LandScope Layer Guide
Your LandScope analysis package contains multiple data layers that work together to reveal the complete story of your property. Think of these layers like transparent maps that can be viewed individually or stacked together to show relationships between different land characteristics. Our LiDAR-derived layers expose different dimensions of your landscape—from the physical shape of your terrain to the hidden patterns of water movement, from the solar exposure of every slope to the fundamental landforms that determine soil depth and drainage.
The power of this system lies not just in individual layers but in how they interact; water accumulation patterns make more sense when viewed with slope data, while aspect analysis becomes more valuable when combined with elevation contours. The following sections detail each layer in your package, explaining what information it contains and how to use it for practical land decisions.
Elevation
Elevation Statistics
Your elevation report provides four key measurements that reveal your property's vertical profile. Maximum elevation marks your highest point, while minimum elevation identifies the lowest spot where water typically collects or exits a property. The difference between these numbers—your total elevation change—determines gravity-flow potential and development complexity. Mean elevation gives the average height across your property, and standard deviation indicates terrain variability: low values mean uniform, rolling terrain, while high values indicate dramatic elevation changes.
These measurements directly impact your property's development potential and operating costs. Every 0.7m/2.3 feet of elevation creates one PSI of water pressure—meaning 30.5/100 feet of elevation change can deliver 40+ PSI without pumps, sufficient for household and irrigation needs. Standard deviation reveals whether you're working with consistent grades or complex terrain requiring careful planning. Properties with significant elevation changes often span multiple climate zones (3-5°F cooler per 1,000 feet), enabling diverse growing conditions. These statistics immediately tell you whether gravity-fed water systems are feasible, where frost pockets will form, and how complex your earthwork projects will be.
Elevation Scale Visualization
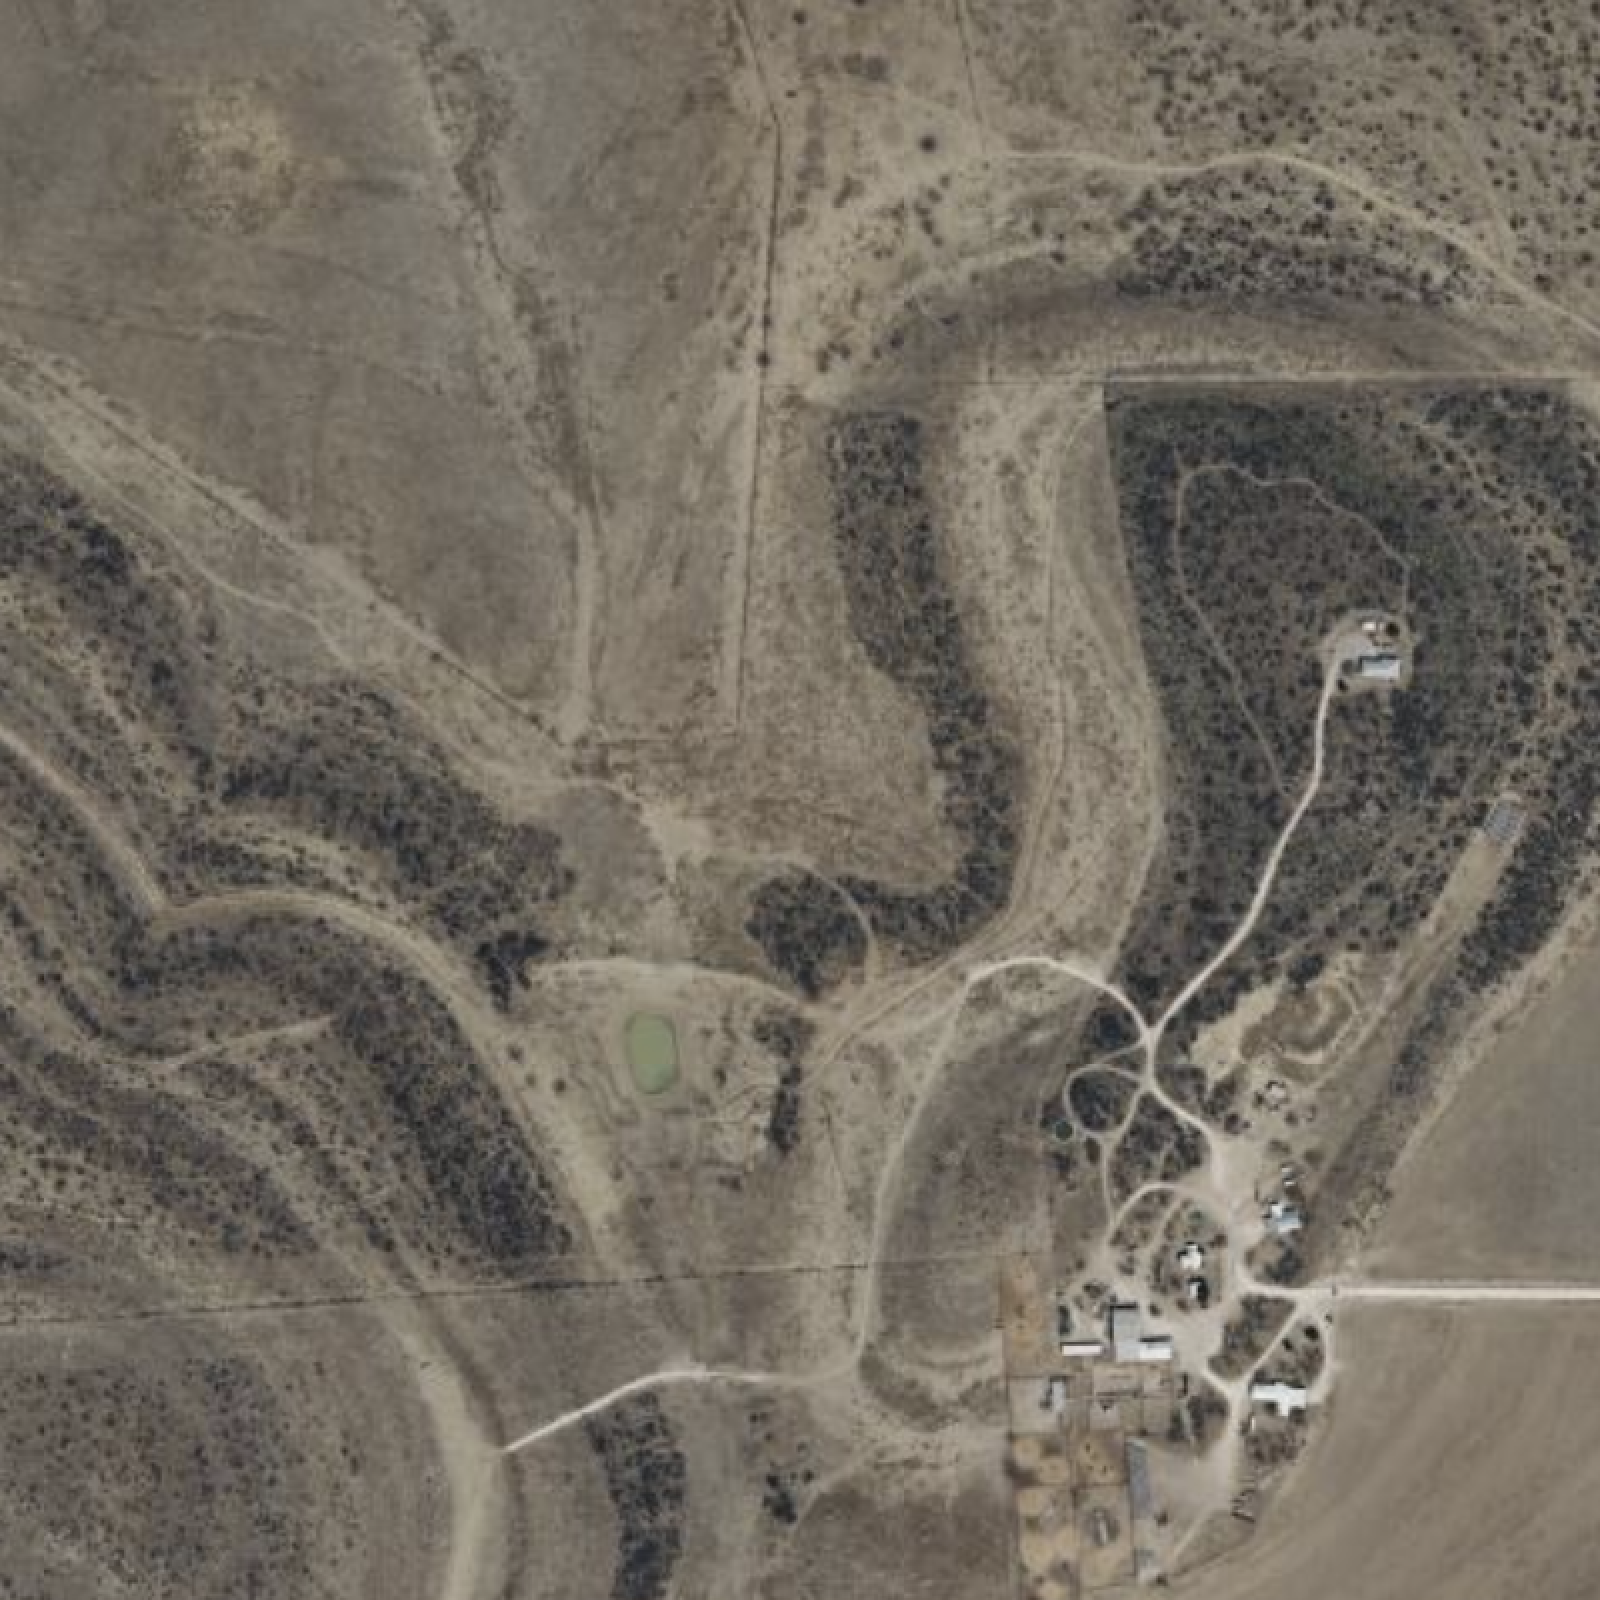
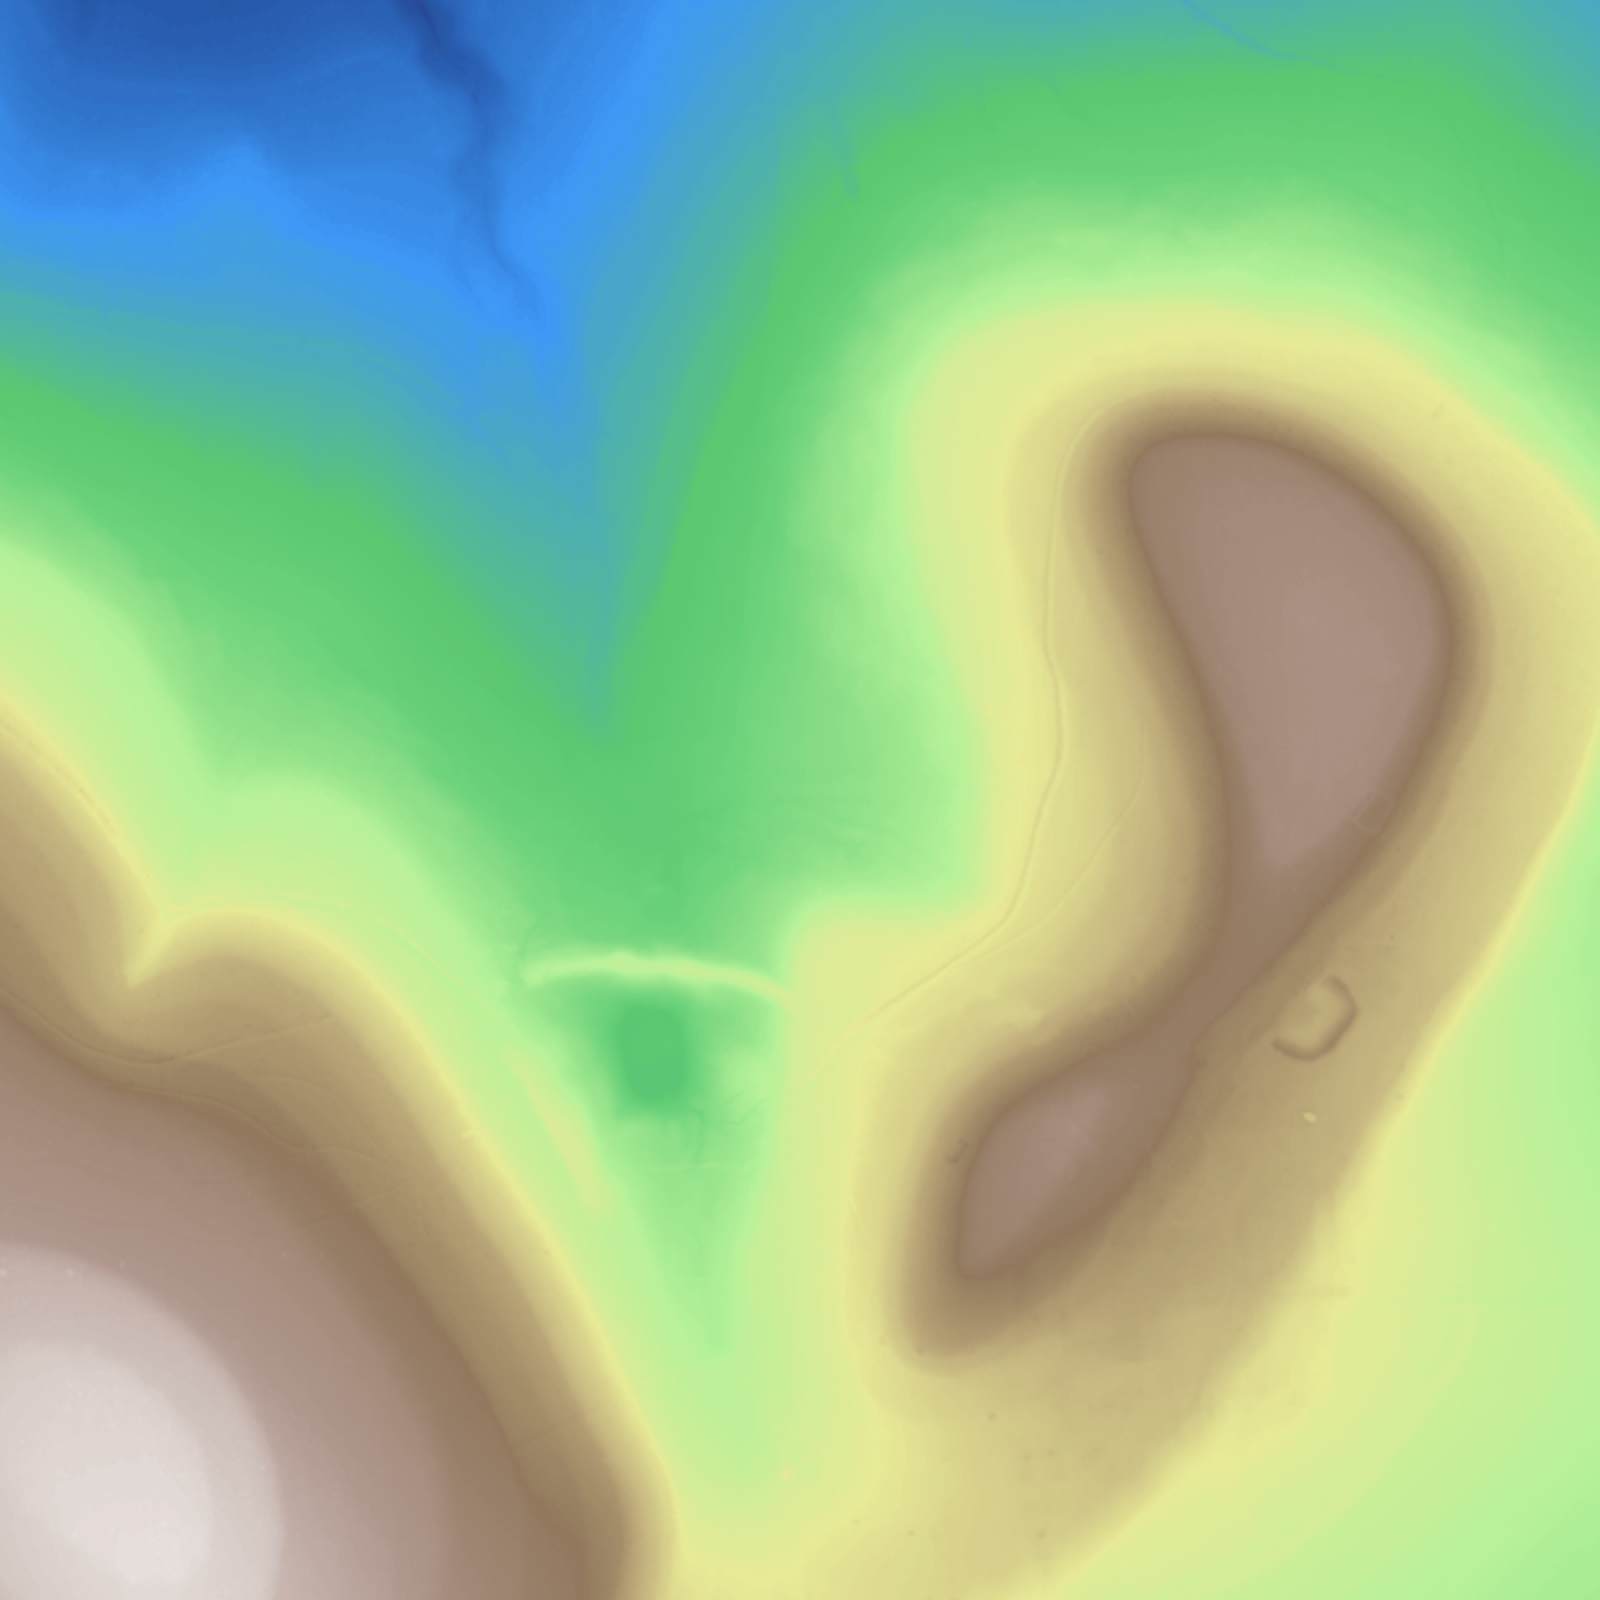
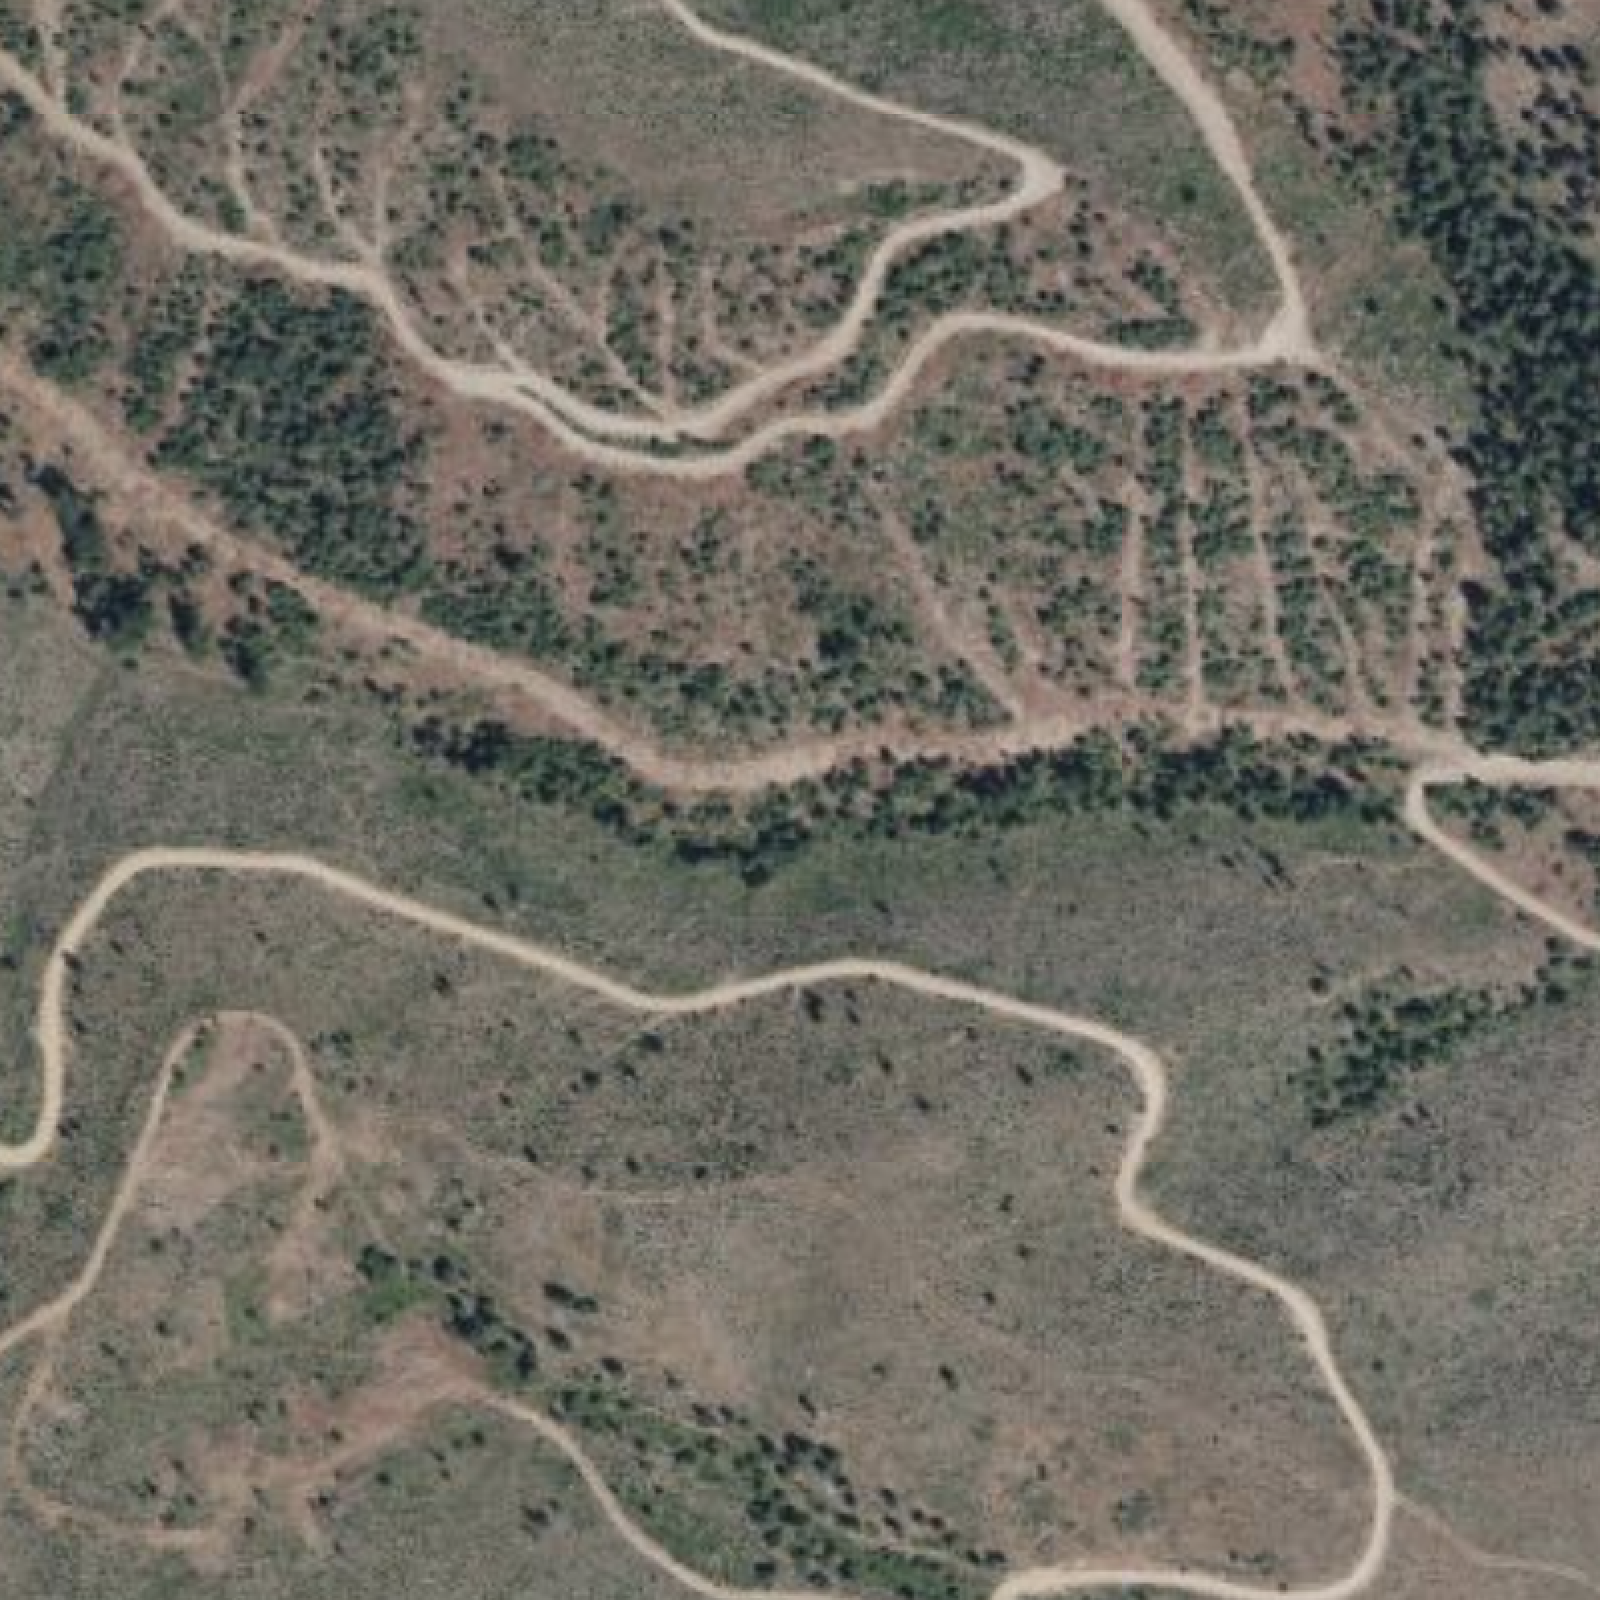
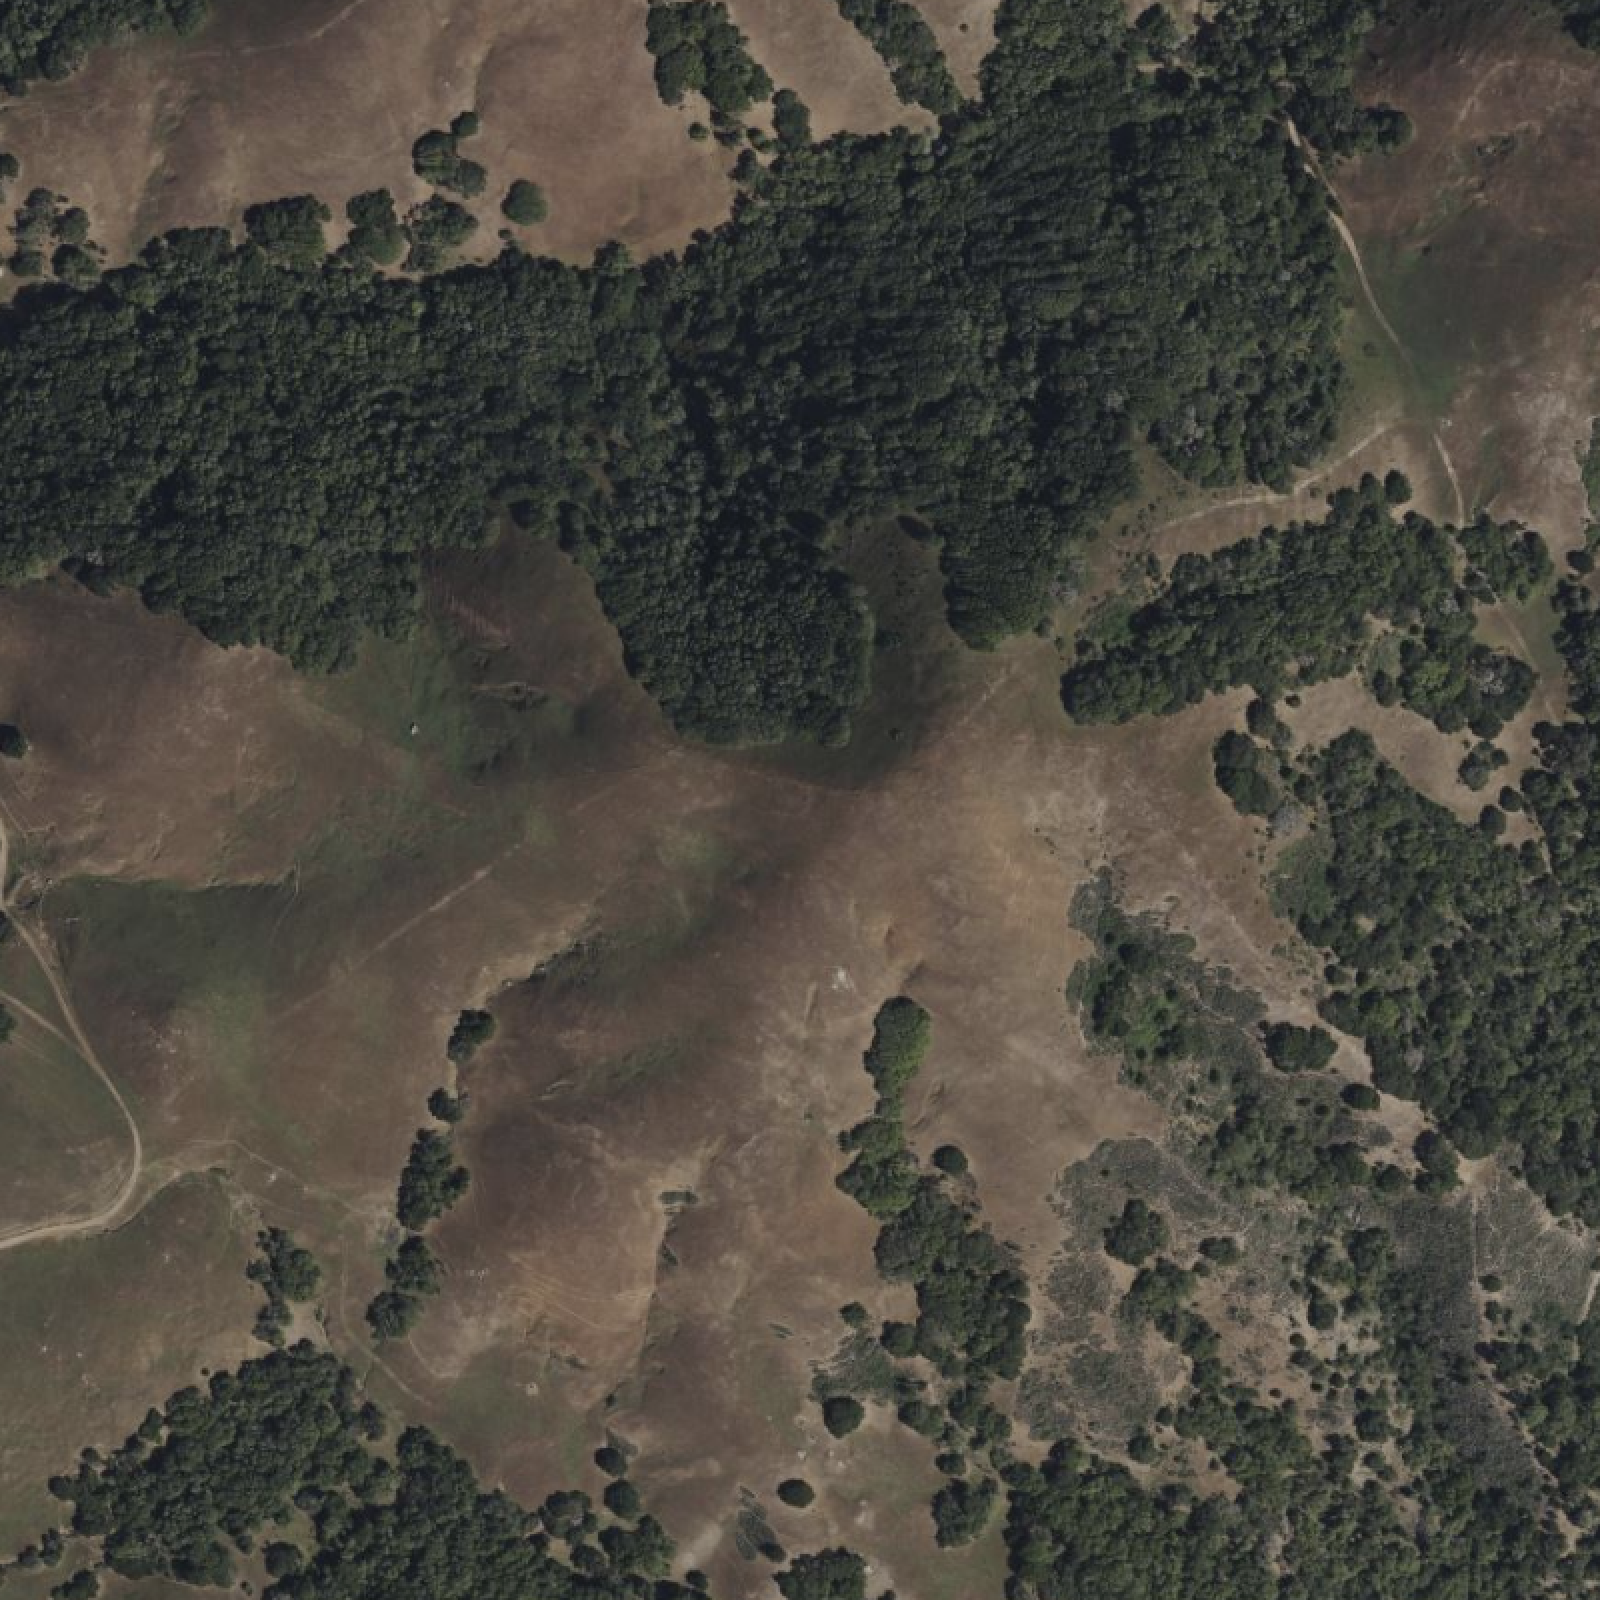
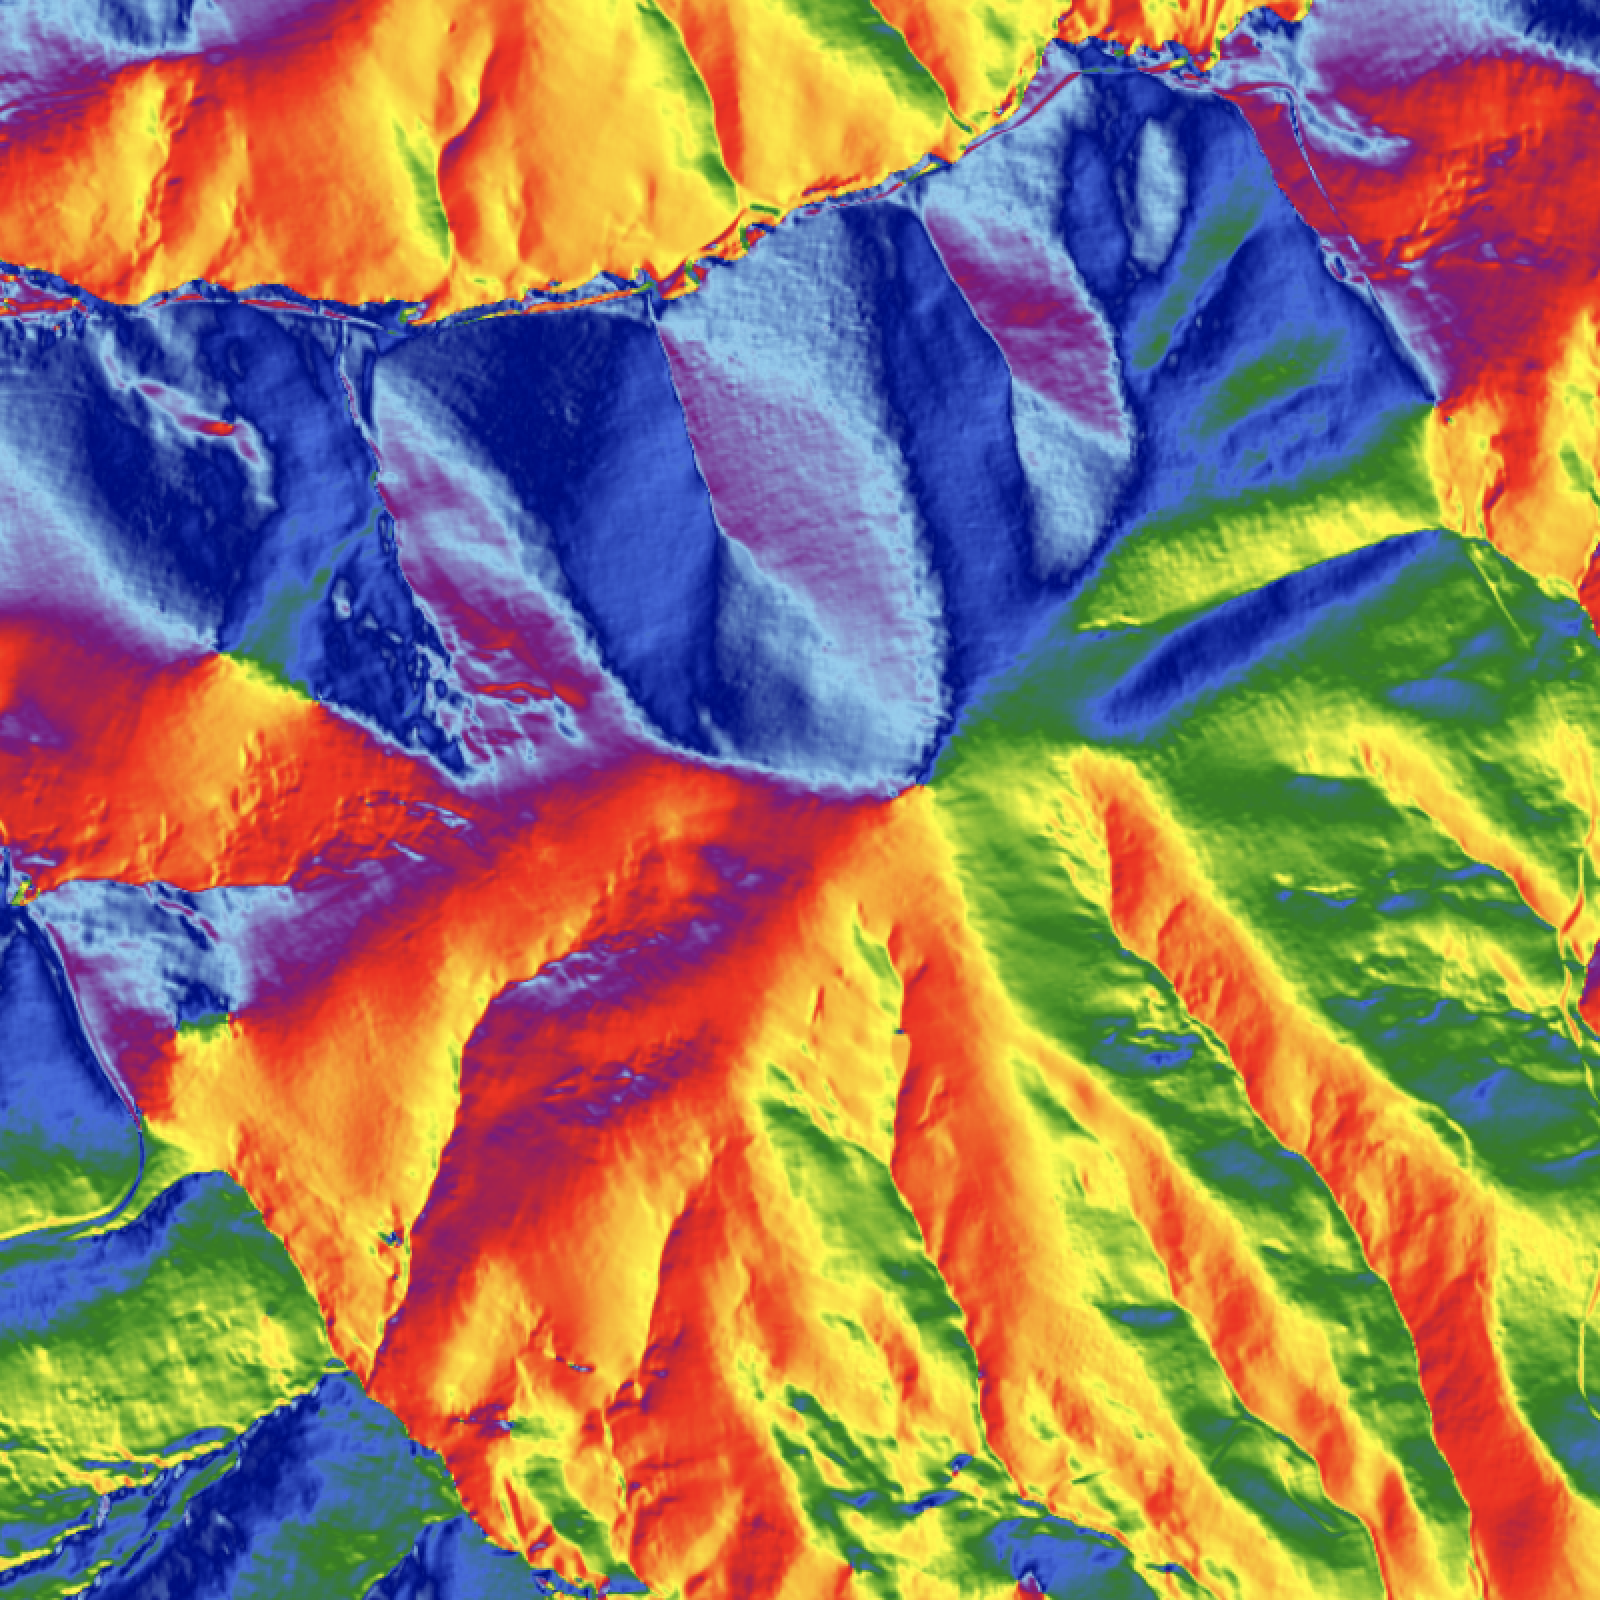
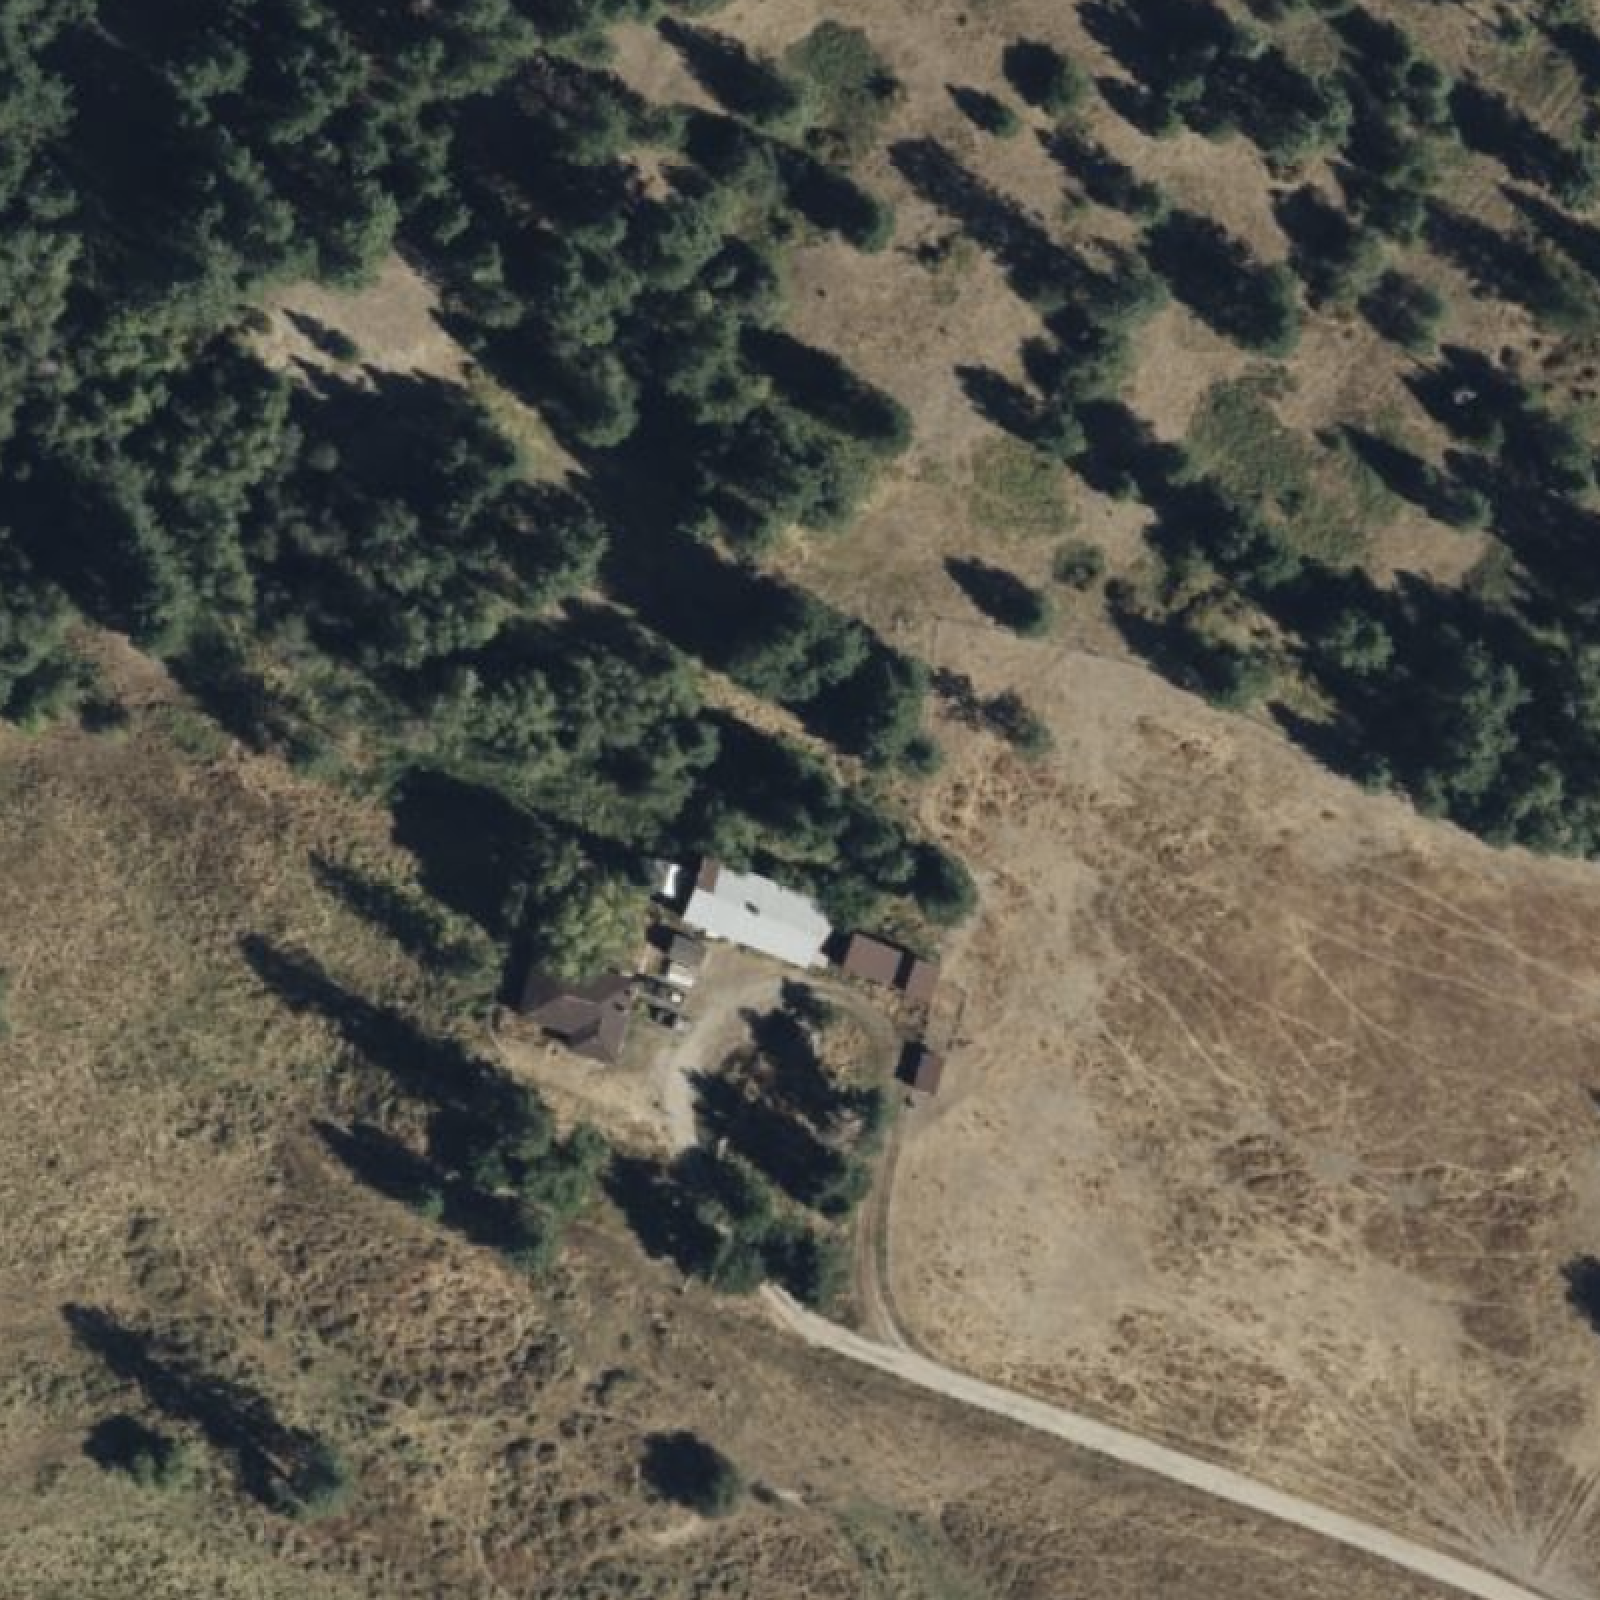
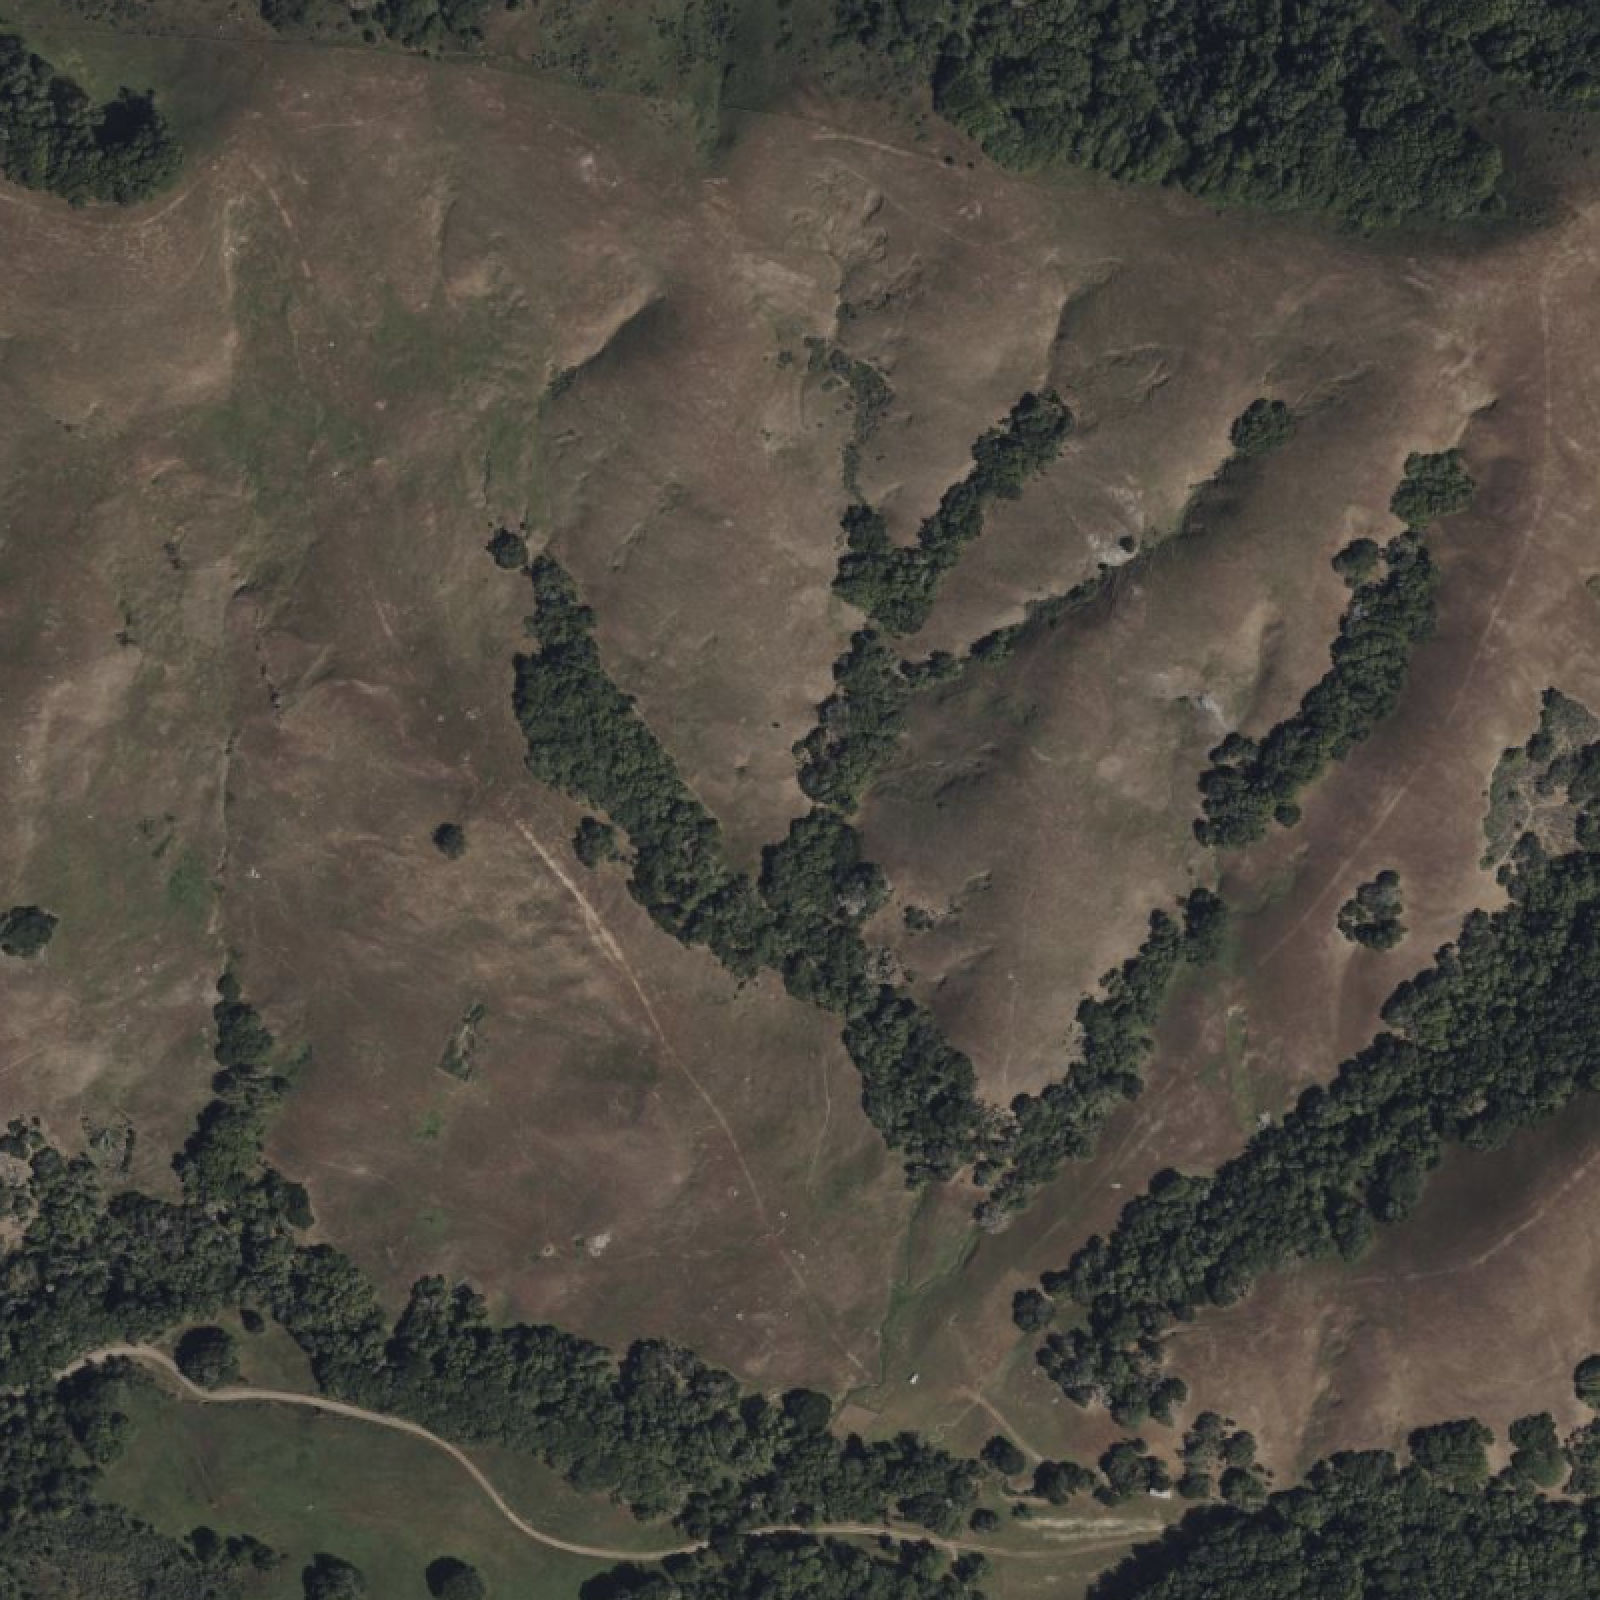
The elevation scale layer transforms raw elevation data into an intuitive color-coded map that makes your land's topography instantly understandable. This layer makes it easy to identify major landforms, trace ridgelines, spot valleys, and understand the overall flow of your landscape. When combined with aerial imagery, elevation scale helps you see why certain areas stay wet, where cold air pools, and which spots naturally catch the morning sun.
This visual translation of elevation data becomes a primary planning tool for understanding the big picture of your property. Where traditional surveying might identify a "good building site," elevation scale visualization reveals the entire system of benches, shoulders, and natural terraces across your land, allowing you to choose not just a good site but the best site. The color patterns immediately show where water wants to collect, making pond siting intuitive rather than guesswork. Spring lines often appear as color transition zones where groundwater is forced to the surface by underlying geology. This layer helps you communicate with contractors, designers, and family members who might struggle with traditional topographic maps—everyone intuitively understands that blue is low and red is high, making collaborative planning more effective.
Hillshade
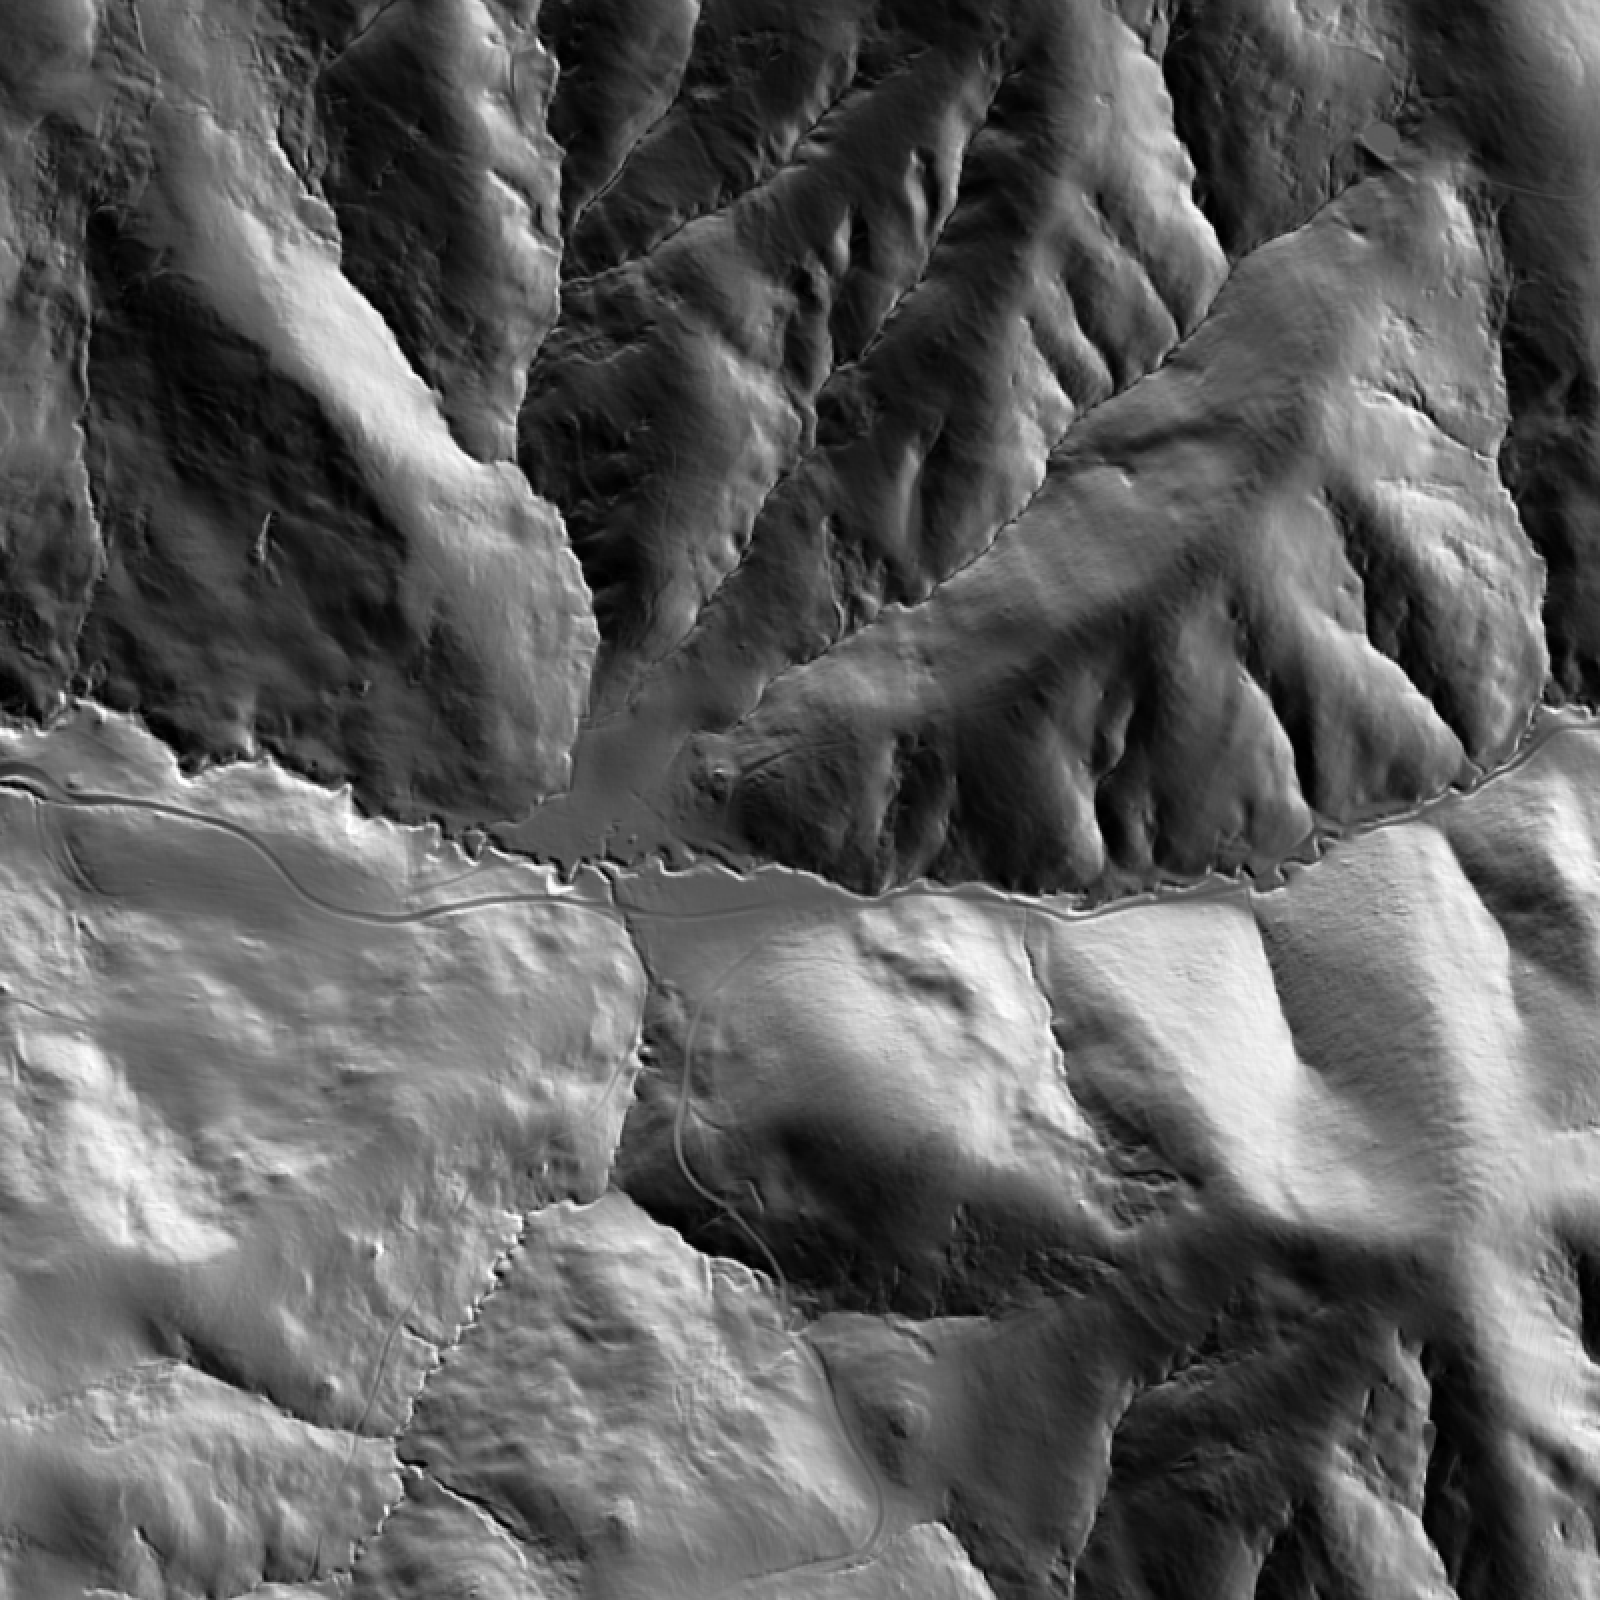
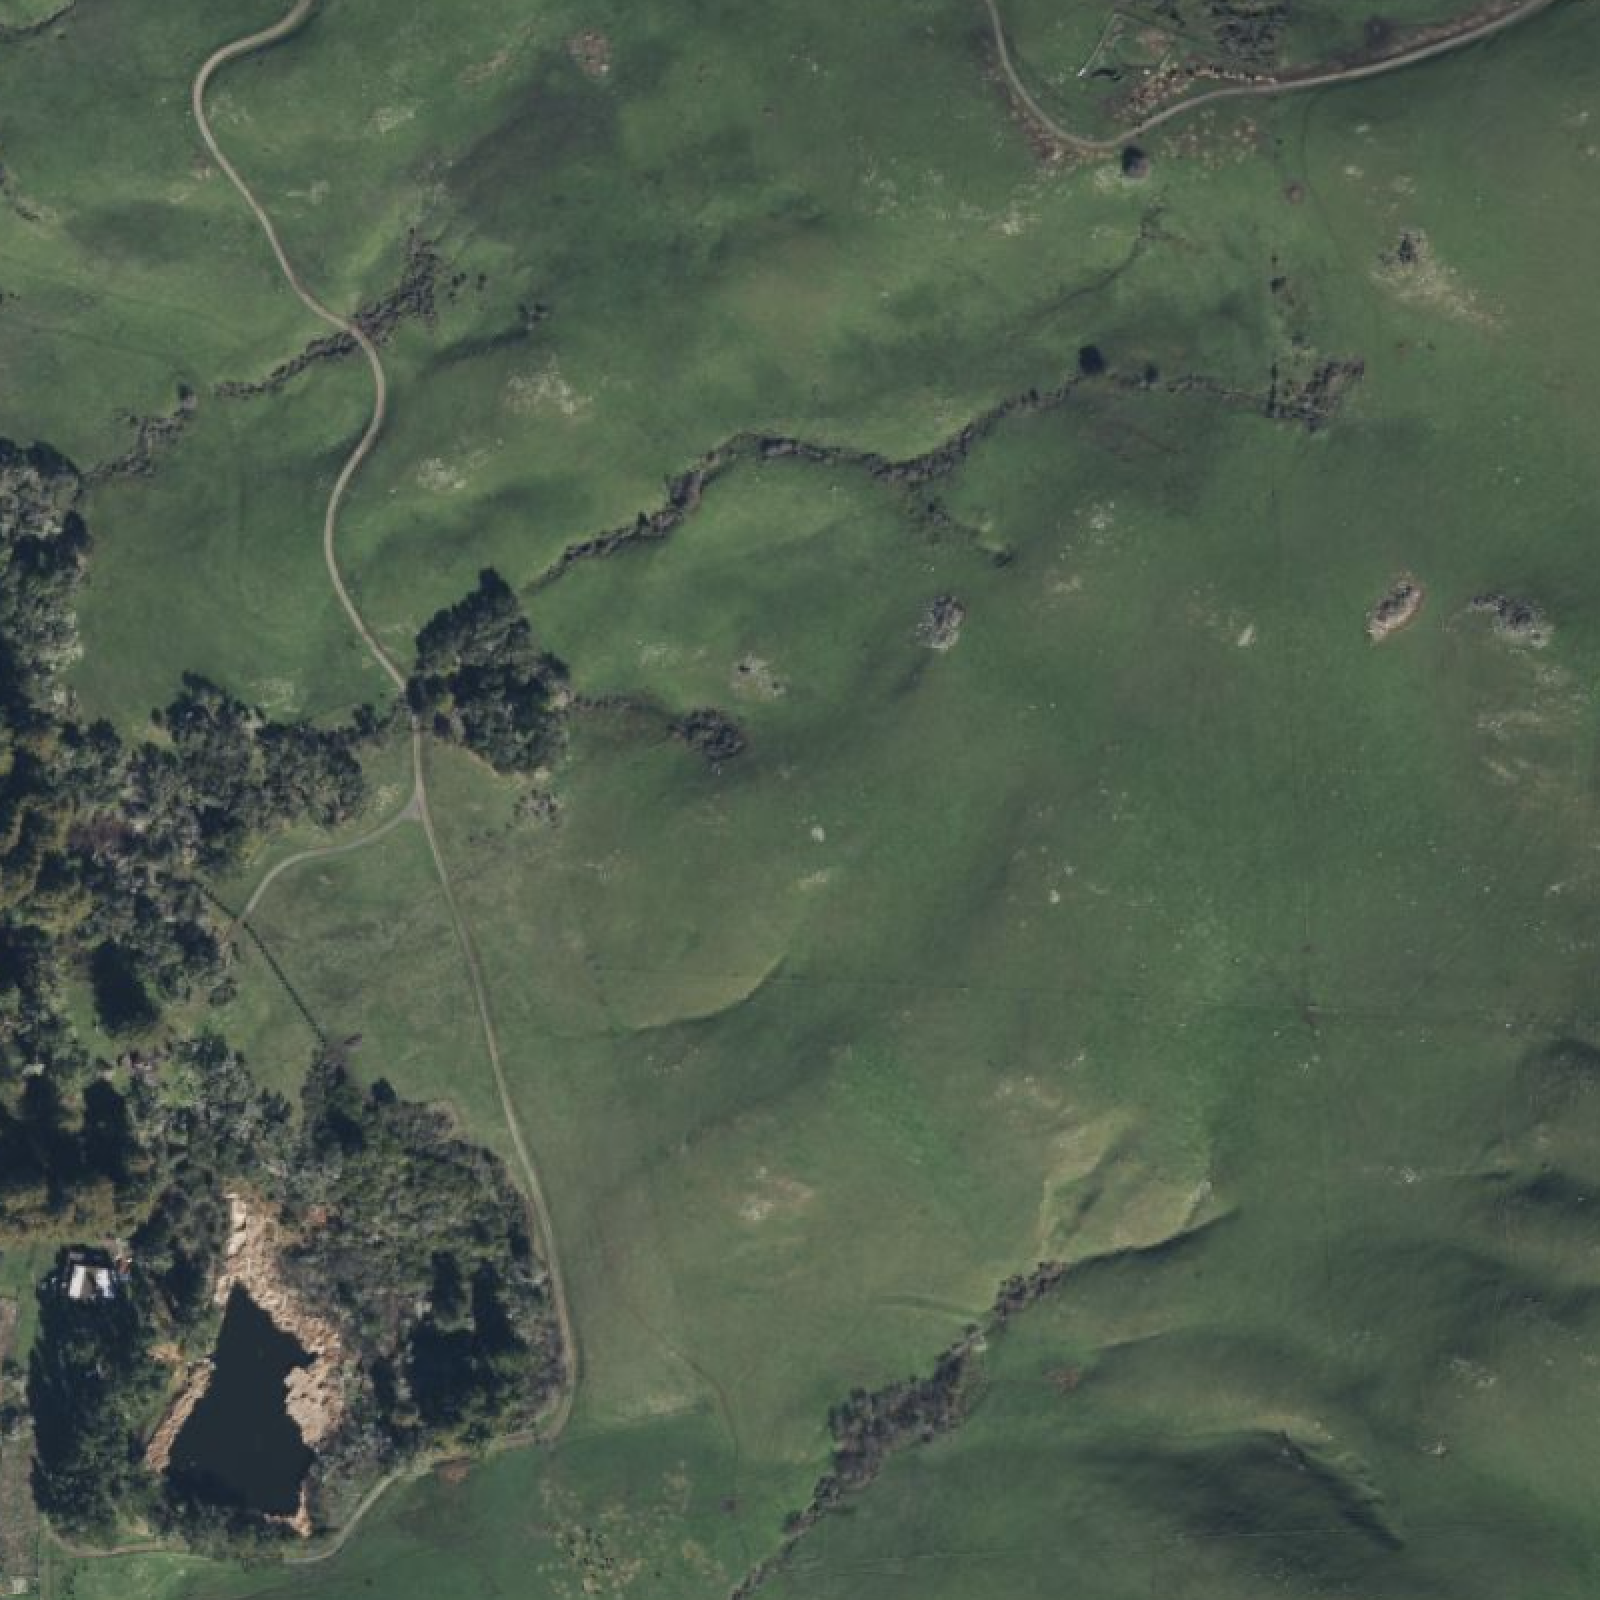
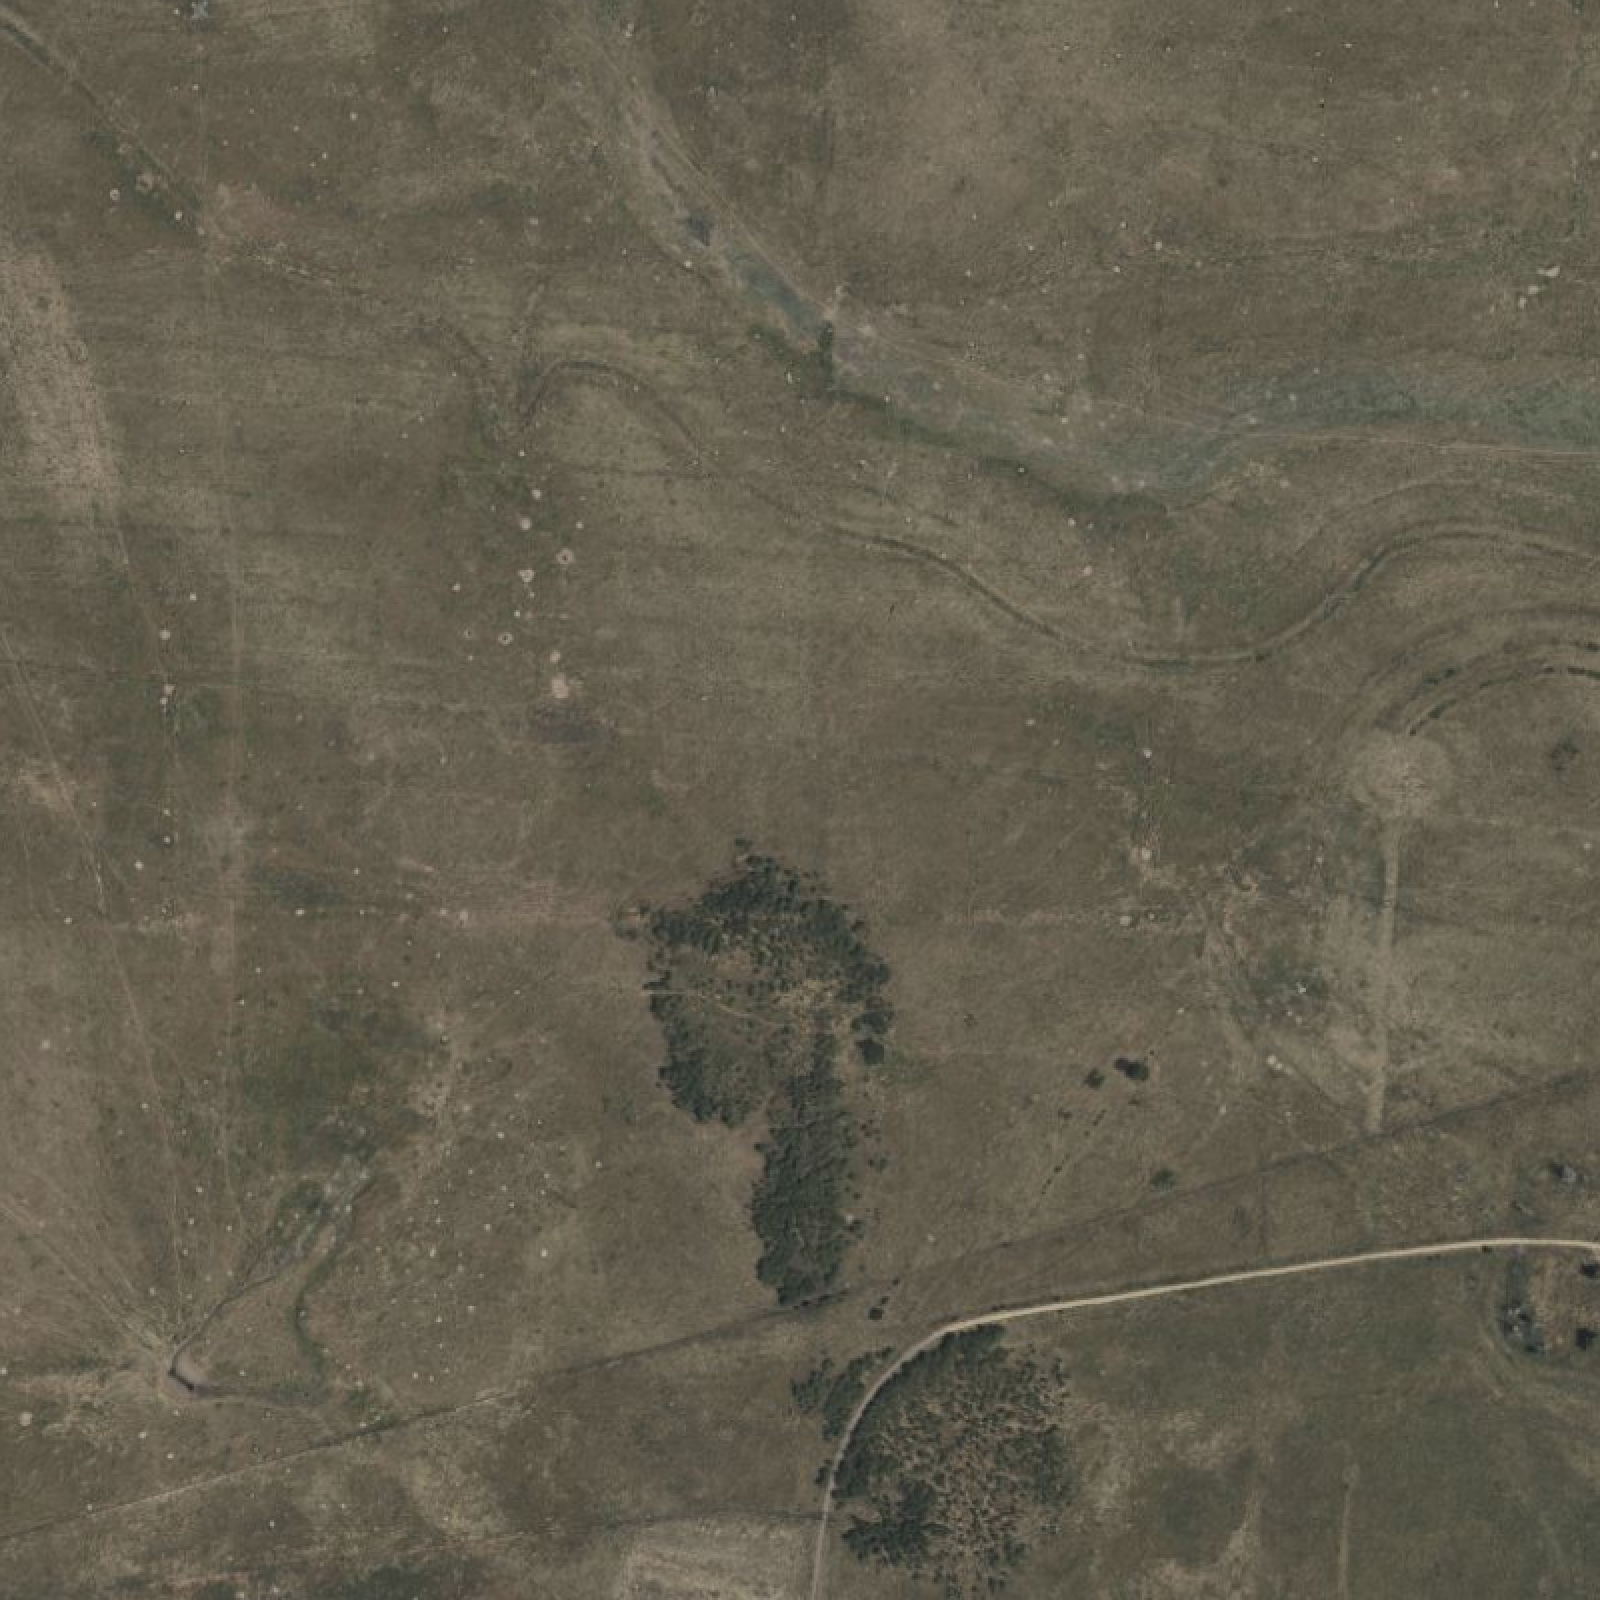
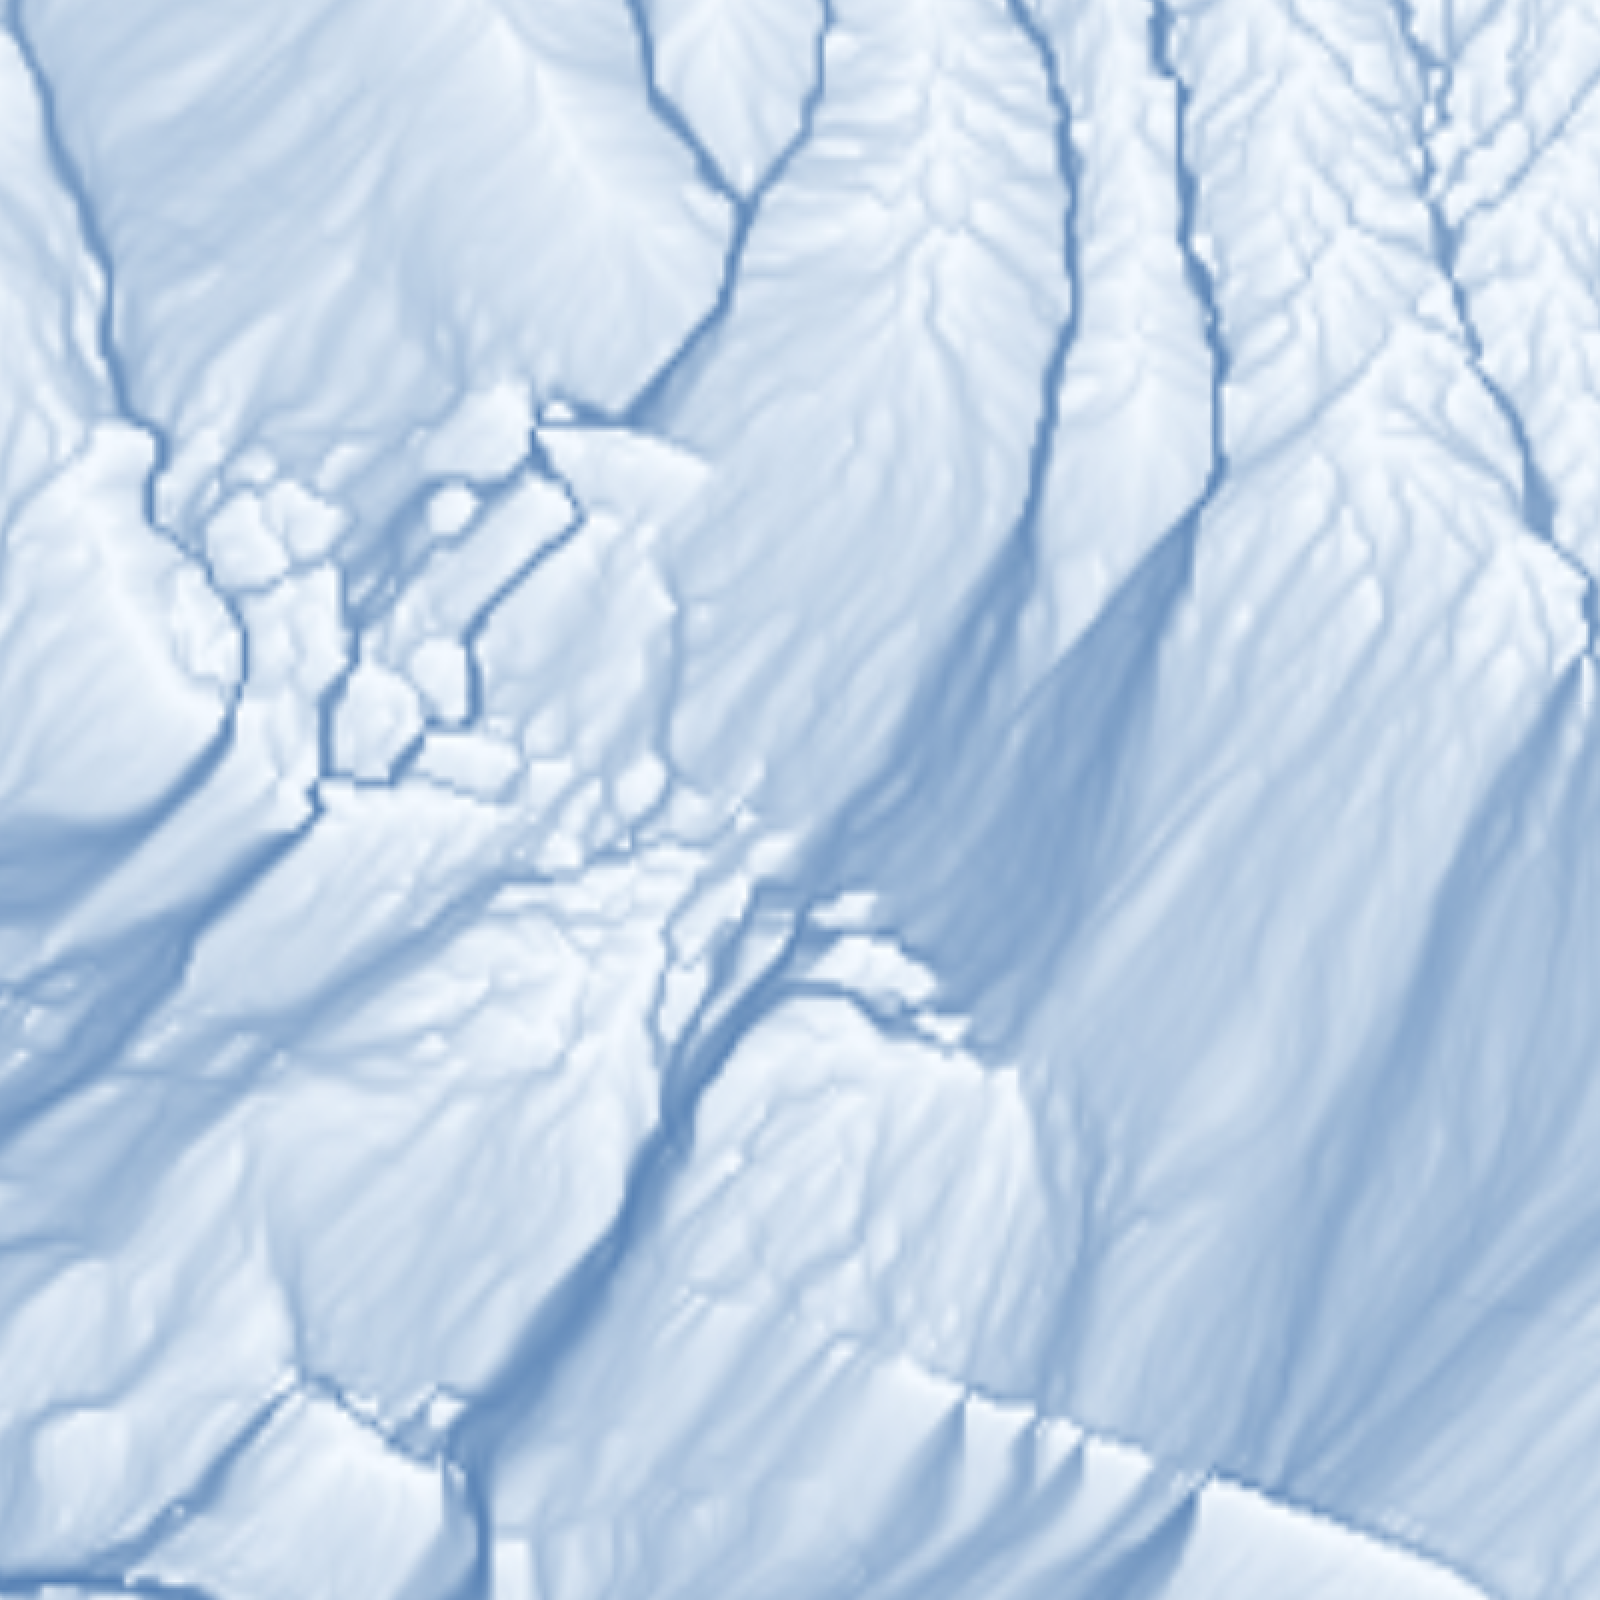
Hillshade analysis simulates how sunlight would illuminate your landscape from a specific angle, creating a relief map that makes terrain features pop out in three dimensions. This layer reveals subtle features that contour lines and color maps might miss—small knolls, gentle swales, old roadbeds, even archaeological features like forgotten foundations or earthworks. By showing terrain as if lit by low-angle light, hillshade creates shadows and highlights that make the land's texture visible.
The practical value of hillshade lies in its ability to reveal landscape features that directly impact land use decisions but are difficult to detect through field observation alone. Old roadbeds and logging paths become clearly visible as linear shadows, showing you existing infrastructure that could be restored rather than building new access from scratch. Former agricultural terraces, building foundations, and other human modifications stand out as geometric patterns against the natural terrain. Natural benches and level areas suitable for development appear as bright, evenly lit surfaces, while steep slopes show as dark shadows. This visualization is particularly valuable during initial site planning, as it provides an immediate understanding of terrain complexity that helps identify the most suitable areas for different uses. When combined with other layers, hillshade serves as a visual base map that makes all other data more interpretable—it's easier to understand why water flows certain ways or why some areas stay cooler when you can actually see the shape of the land that creates these conditions.
Contour Lines
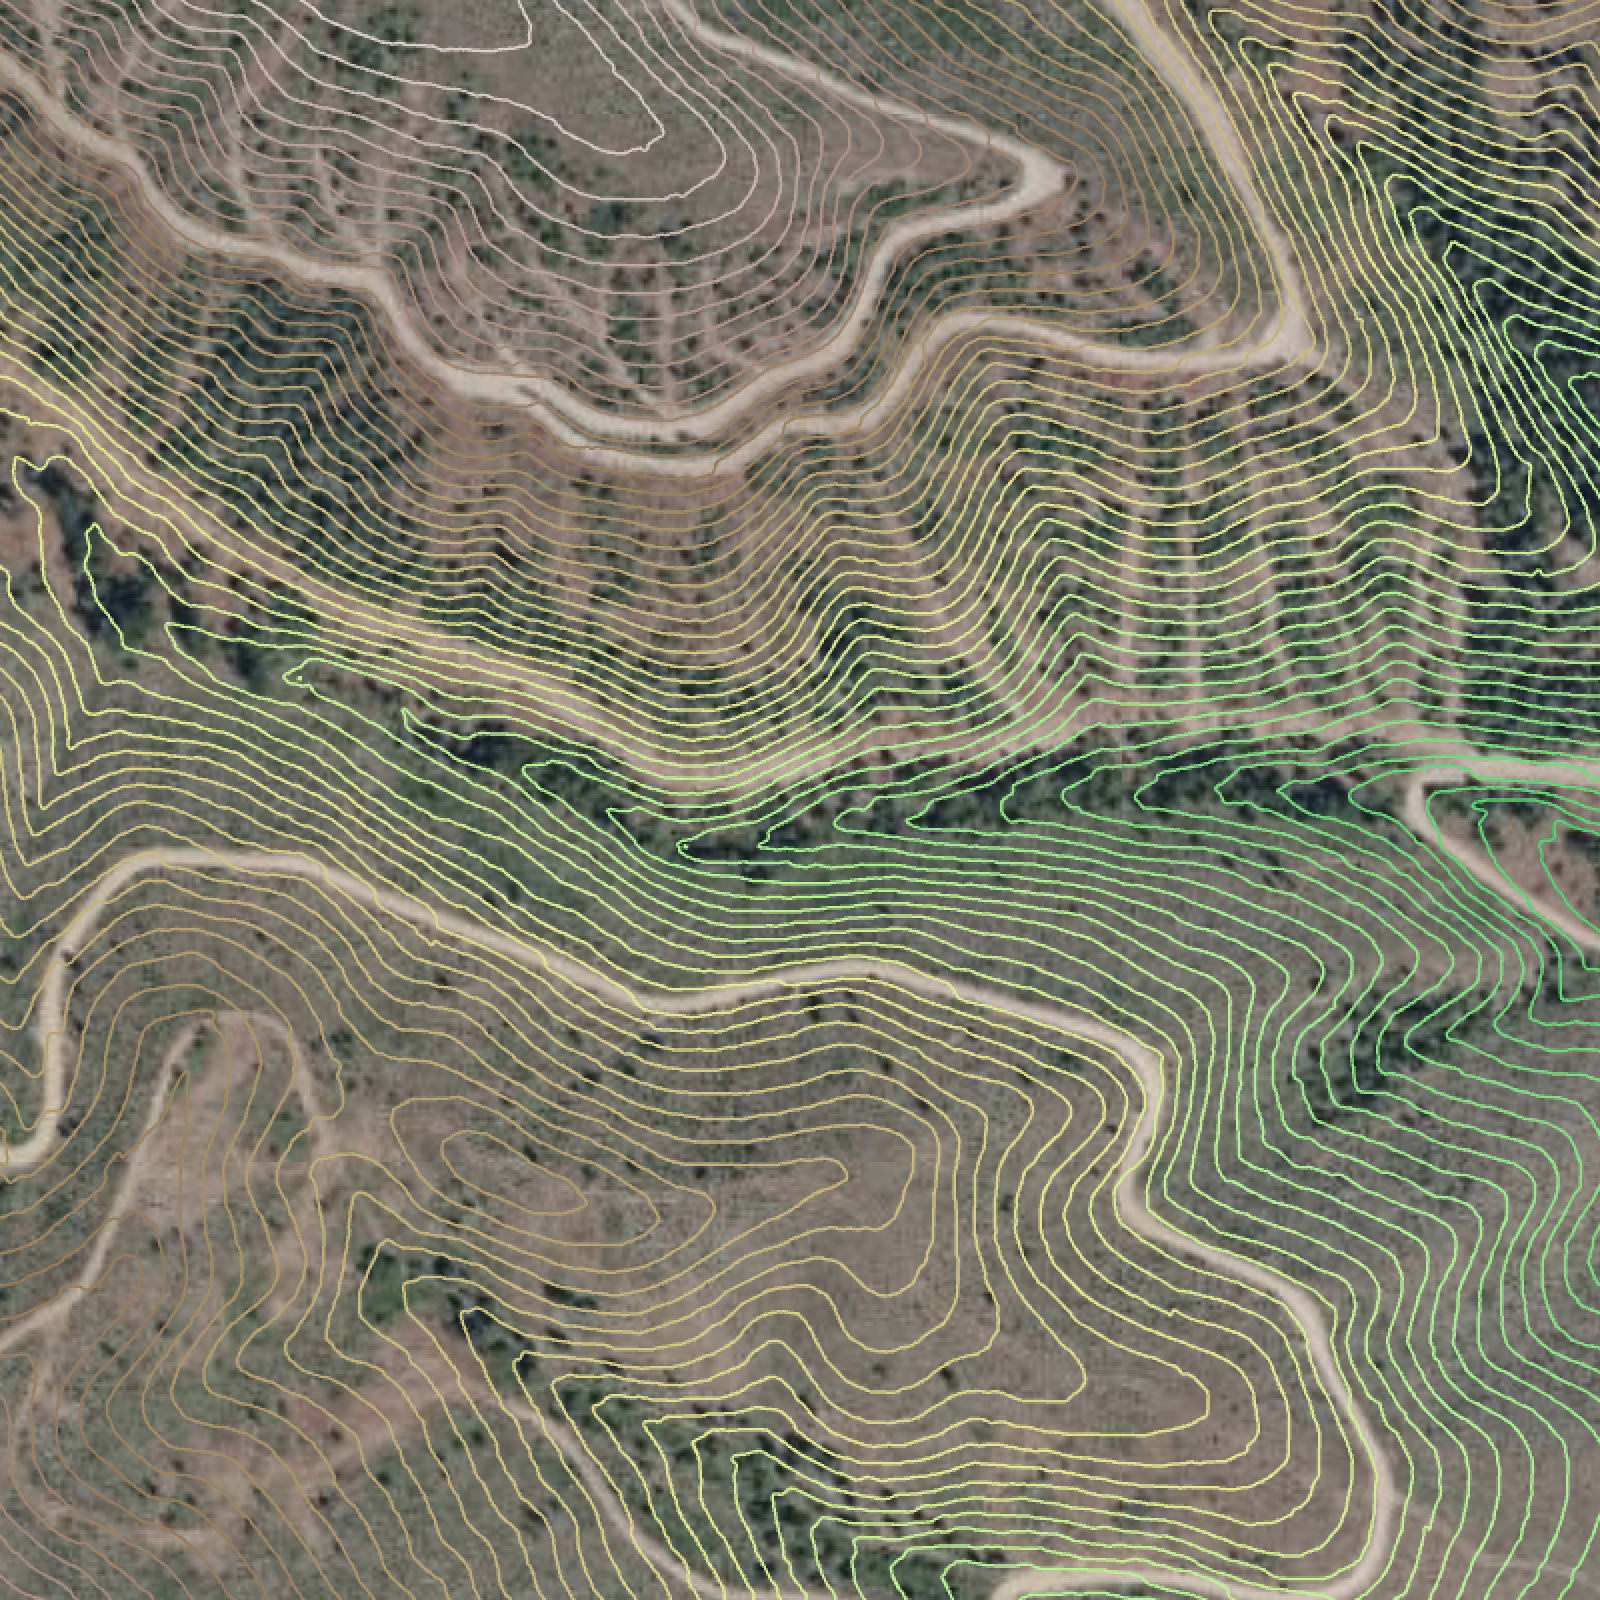
Contour lines are the universal language of elevation, connecting points of equal elevation to create nested shapes that map your land's three-dimensional form. Closely spaced contours indicate steep slopes while widely spaced lines show gentle terrain. Understanding contours is essential because they show your properties blueprint for water movement—water always flows perpendicular to contour lines, taking the steepest path downhill. We provide four different contour intervals because different projects demand different levels of precision.
0.5m Contours (1.6 feet)
Ultra-fine contours for precision work where every inch matters. Essential for designing level building pads, calculating exact cut-and-fill volumes, creating perfectly graded garden terraces, or installing delicate water features like bioswales. This level of detail shows micro-topography that affects surface drainage around structures.
1m Contours (3.3 feet)
The gold standard for detailed land planning. Perfect spacing for designing swales, planning walking paths with comfortable grades, laying out irrigation lines, and creating accurate cross-sections for pond construction. Most permaculture earthworks reference 1-meter contours as the ideal interval for water harvesting features.
2m Contours (6.6 feet)
Ideal for general property planning and larger earthworks. Use these for orchard layout on slopes, planning fence lines that follow terrain, designing riding trails, and understanding overall drainage patterns. This interval balances detail with readability for whole-property visualization.
3m Contours (9.8 feet)
Best for big-picture planning and large properties. Excellent for initial site assessment, planning major access roads, understanding watershed boundaries, and designing large water impoundments. This interval reduces visual clutter while still showing significant terrain features.
The true power of contour mapping emerges when you realize these lines are the instructions for working with your land rather than against it. The multiple intervals we provide serve different phases of your land development process. Those precise 0.5-meter contours become invaluable when you're grading a building pad and need to minimize expensive cut-and-fill operations—being able to see exactly where the land naturally levels out can save tens of thousands in site preparation. The broader contours guide your overall design, showing where access roads can maintain steady, equipment-friendly grades without excessive earthworks. Most importantly, contours reveal the hidden potential for water harvesting systems that future-proof your property against both drought and flood.
A single swale placed perfectly on contour can infiltrate thousands of gallons of runoff that would otherwise erode your soil, turning a problem into a resource that feeds your landscape for decades to come. Working on contour (along these lines rather than across them) is a fundamental principle of sustainable land management, preventing erosion and making the most of water resources.
Slope Classifications
Our slope analysis divides your property into ten distinct categories based on degree of incline, with each class representing specific opportunities, limitations, and management requirements. This classification system follows both international standards for land capability and practical thresholds for equipment operation, erosion risk, and suitable land uses. By mapping these precise slope categories across your entire property, we transform subjective terms like "steep" or "gentle" into objective measurements that directly inform land use decisions, development costs, and management strategies.
Slope Classes
- Flat (0-2° / 0-3.49% grade): Level terrain with minimal runoff
- Gentle Slope (2-4° / 3.49-6.99% grade): Slight incline with low erosion risk
- Moderate Slope (4-8° / 6.99-13.99% grade): Noticeable incline requiring some erosion control
- Strong Slope (8-12° / 13.99-21.42% grade): Significant incline with moderate erosion risk
- Moderately Steep (12-18° / 21.42-32.46% grade): Challenging for machinery, high erosion risk
- Steep (18-24° / 32.46-44.47% grade): Difficult for most machinery, very high erosion risk
- Very Steep (24-30° / 44.47-57.73% grade): Dangerous for vehicles, severe erosion risk
- Extremely Steep (30-36° / 57.73-70.99% grade): Hazardous for conventional uses, specialized management required
- Excessively Steep (36-45° / 70.99-100% grade): Very hazardous, high mass movement risk
- Hazardously Steep (>45° / >100% grade): Extremely steep, extreme hazard for most activities
This detailed slope classification transforms risk management from reactive to proactive, saving you from costly mistakes and liability issues. When you know exactly where your 18-degree slopes transition to 24-degree slopes, you can plan equipment access that keeps operators safe and prevents rollovers—a critical consideration as most tractors become unsafe on slopes exceeding 15-20 degrees.
For agricultural planning, these classifications dictate everything from crop selection to irrigation design. The economic implications are substantial: earthwork costs increase exponentially with slope, with construction on 20-degree slopes costing three to five times more than on 5-degree slopes. Insurance companies and lenders often require this data, as slope directly impacts liability, development potential, and property values. By matching each area of your land to suitable uses based on precise slope measurements, you create systems that are not only more sustainable but dramatically less expensive to establish and maintain.
Aspect
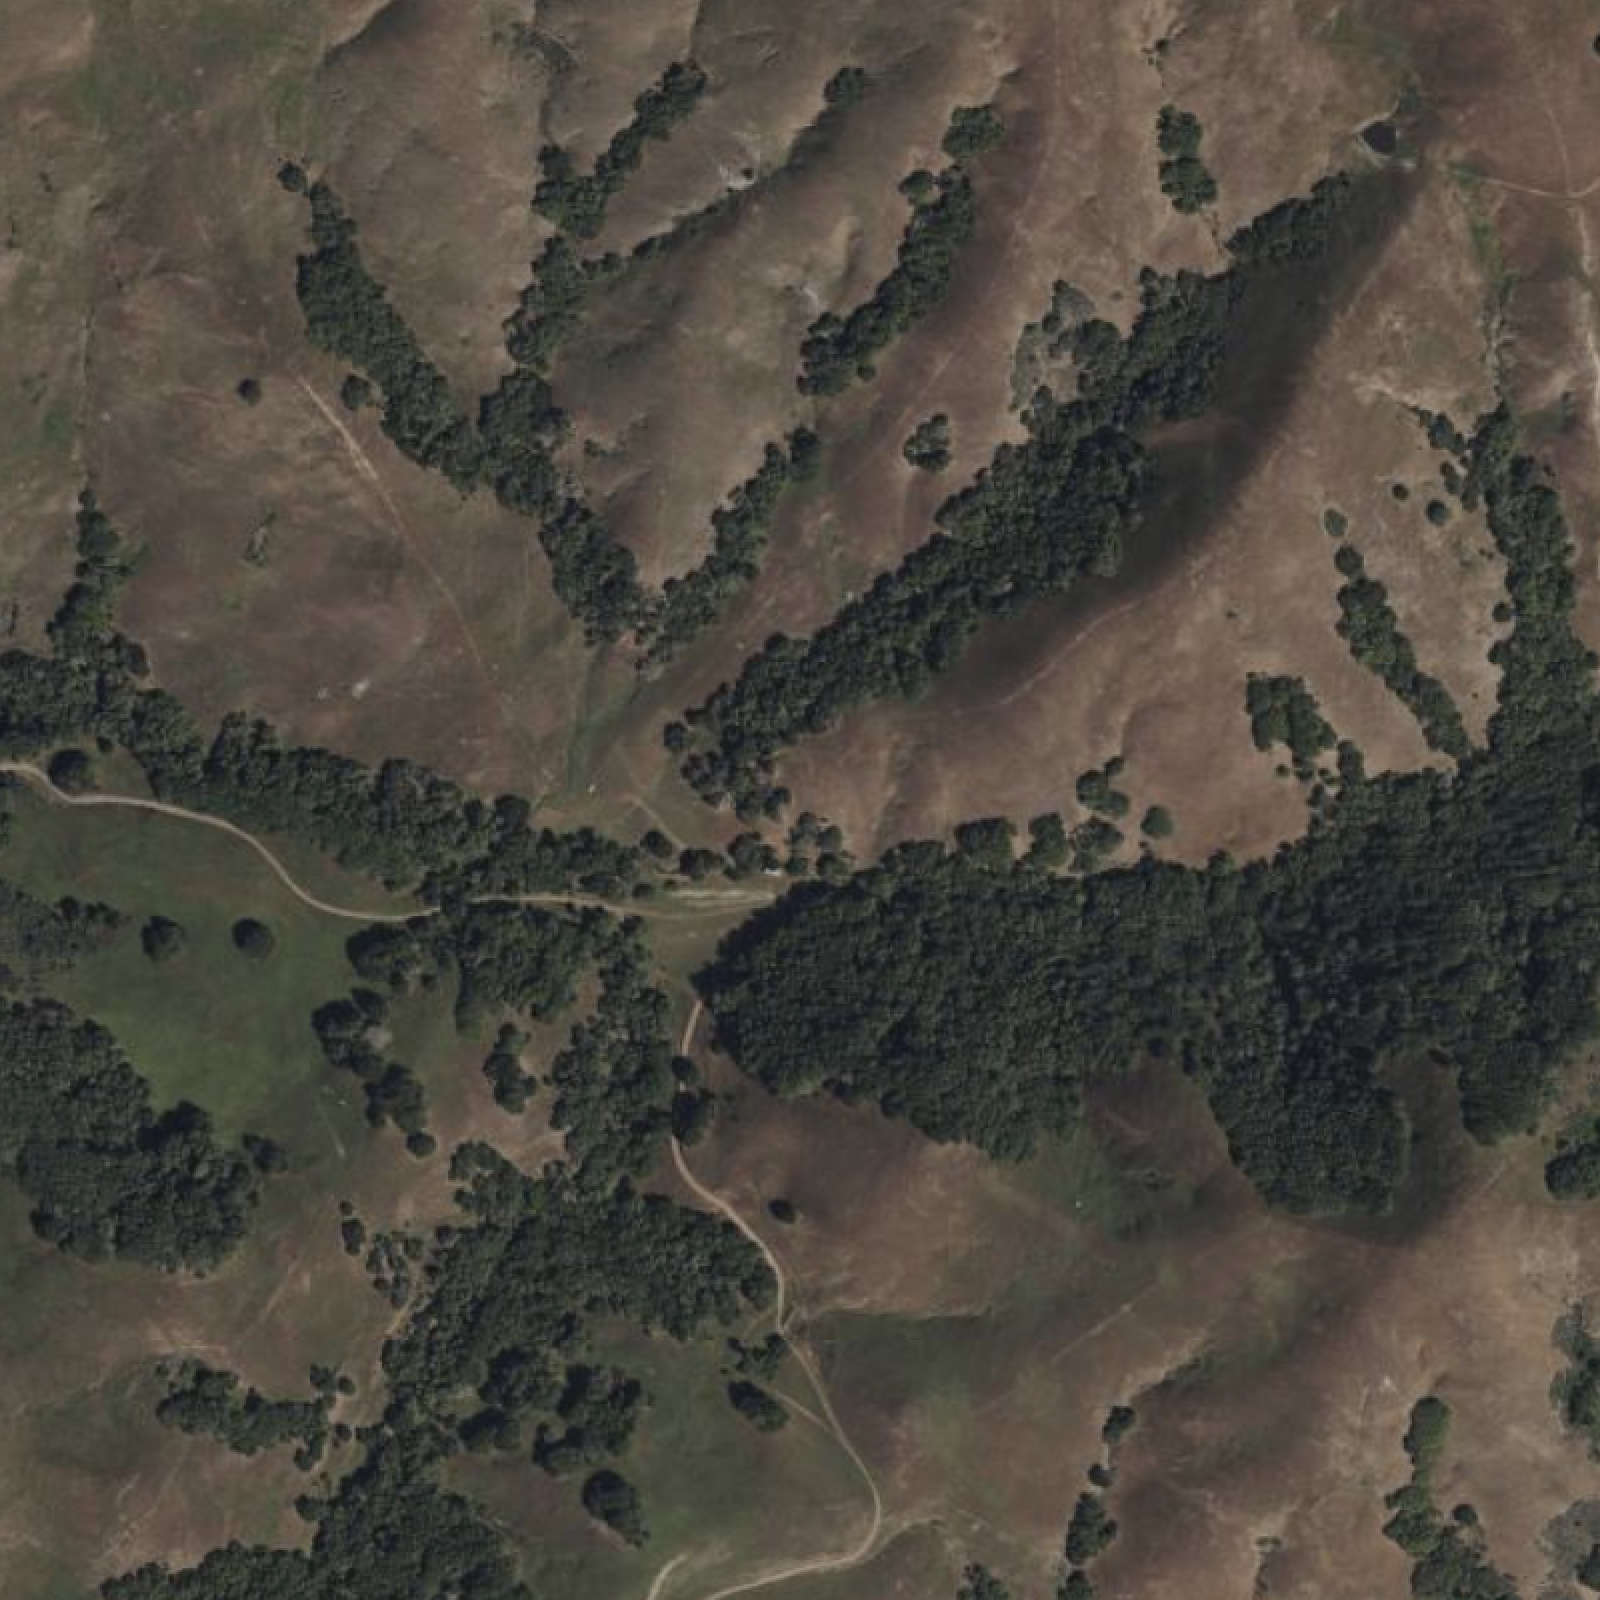
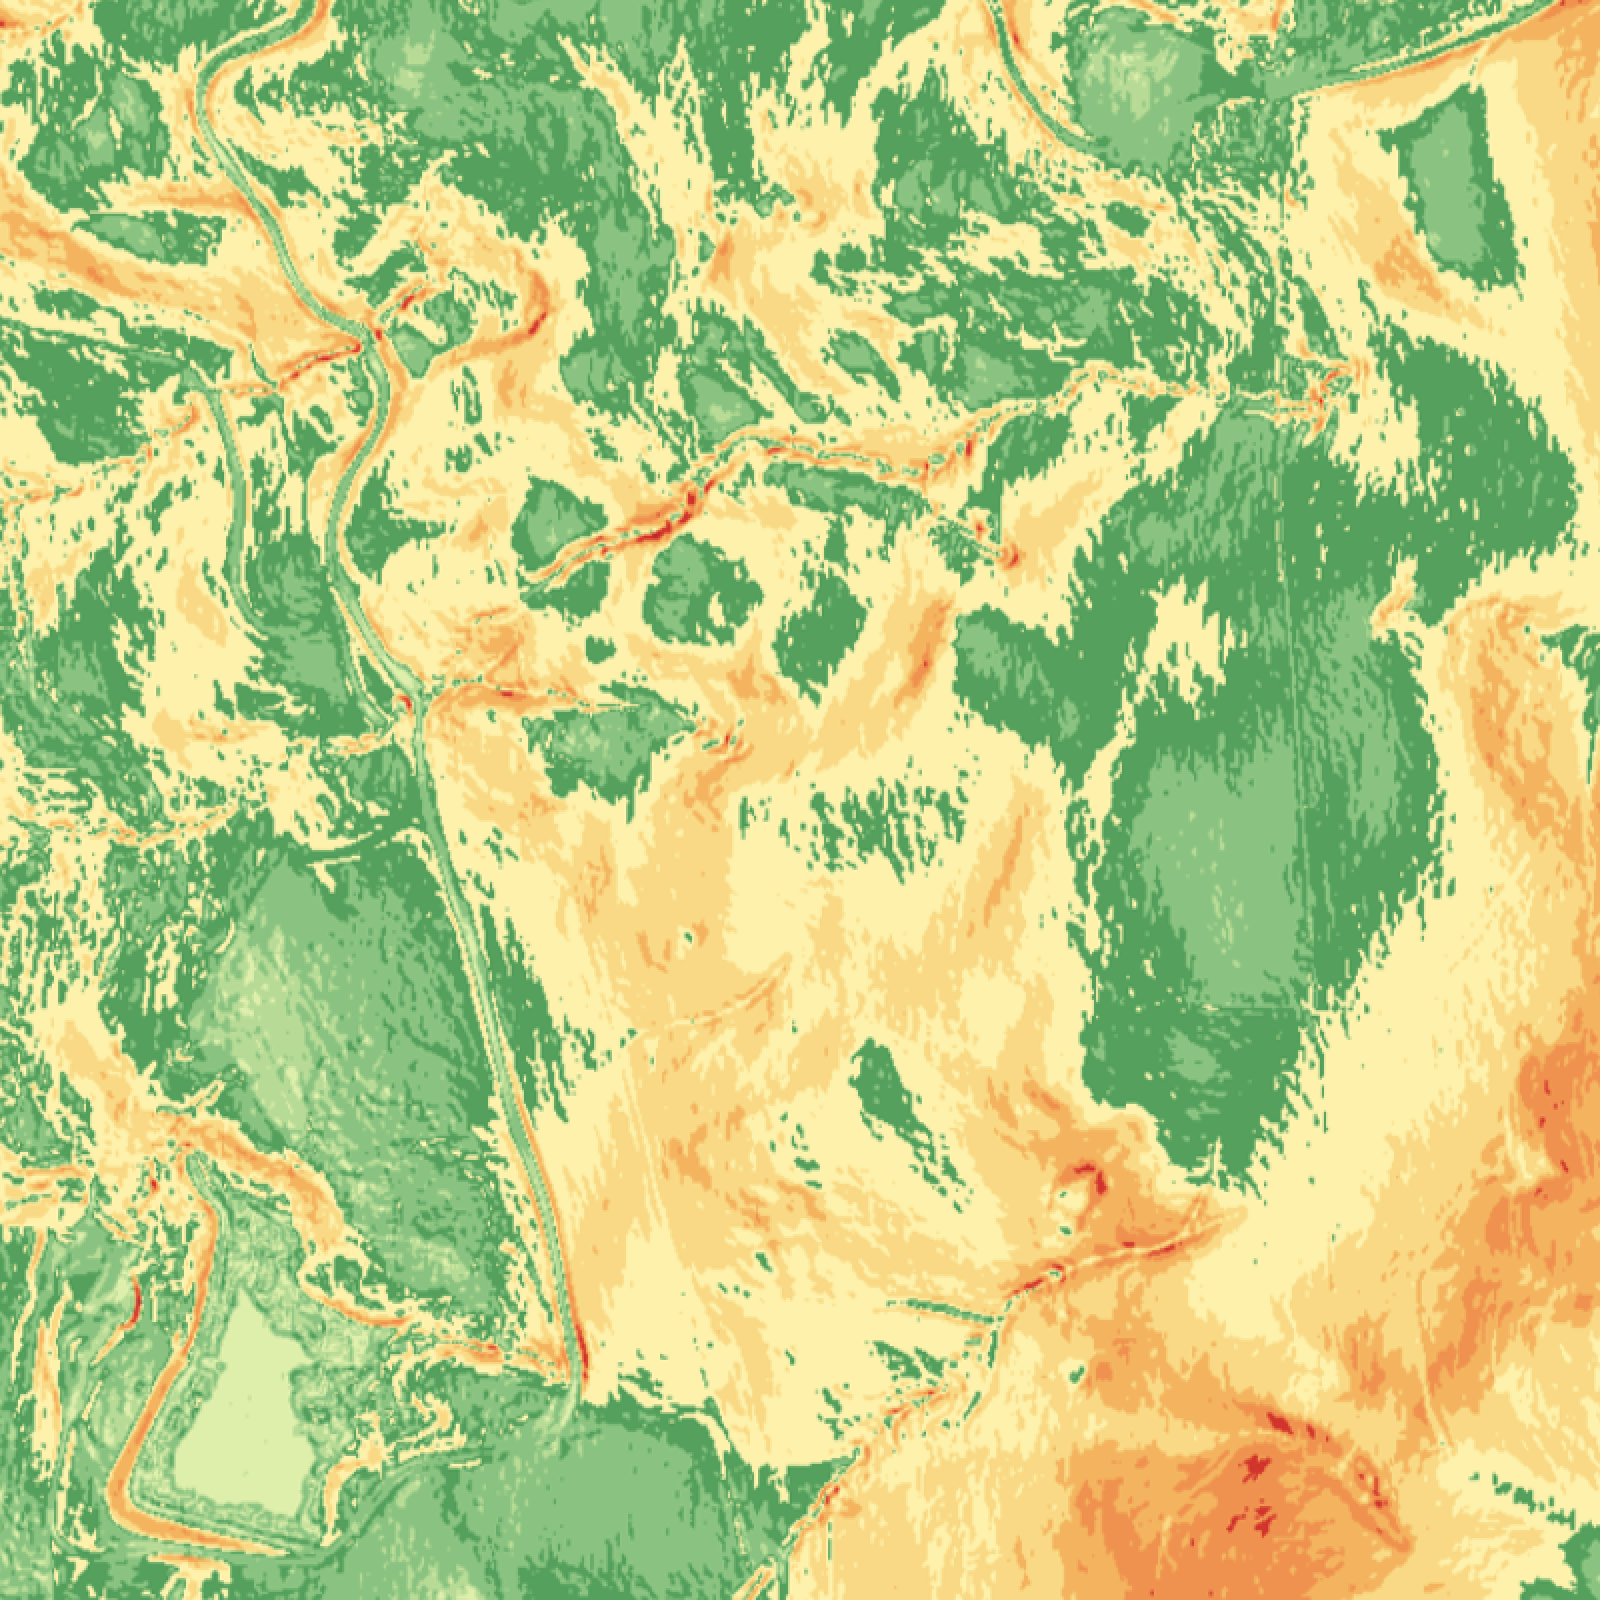
Aspect mapping reveals the compass direction each slope faces, creating a detailed portrait of solar exposure across your property. This analysis divides your land into eight cardinal and intercardinal directions—north, northeast, east, southeast, south, southwest, west, and northwest—each receiving dramatically different amounts and timing of sunlight throughout the day and across seasons. In the Northern Hemisphere, south-facing slopes can receive 40% more solar radiation than north-facing slopes, creating temperature differences of 10-15°F between these exposures on the same property. East-facing slopes warm quickly with gentle morning sun but avoid the heat stress of afternoon exposure, while west-facing areas endure the most intense heat of the day. These directional differences drive everything from snowmelt patterns to plant growth rates, from heating and cooling needs in buildings to the success or failure of specific crops.
Understanding aspect transforms your property from a single growing zone into a mosaic of specialized microclimates, each suited to different purposes. That south-facing slope that seems too dry for vegetables becomes your premium site for solar panels, potentially generating 30-40% more power than panels on level ground. North-facing areas that frustrate attempts at heat-loving crops become assets for summer salad gardens or mushroom cultivation. This knowledge translates directly to energy savings—positioning a home to capture winter sun on south-facing slopes while using north-facing sites for summer cooling can reduce heating and cooling costs by 25-40%. For agricultural diversification, aspect mapping allows you to extend harvest seasons by weeks or even months, planting the same crop on different exposures to stagger maturity. The financial implications extend to property values as well—building sites with favorable southern exposure command premium prices, while those strategic north-facing forests provide valuable timber that grows straighter and taller in the consistent, indirect light.
Topographic Wetness Index (TWI)
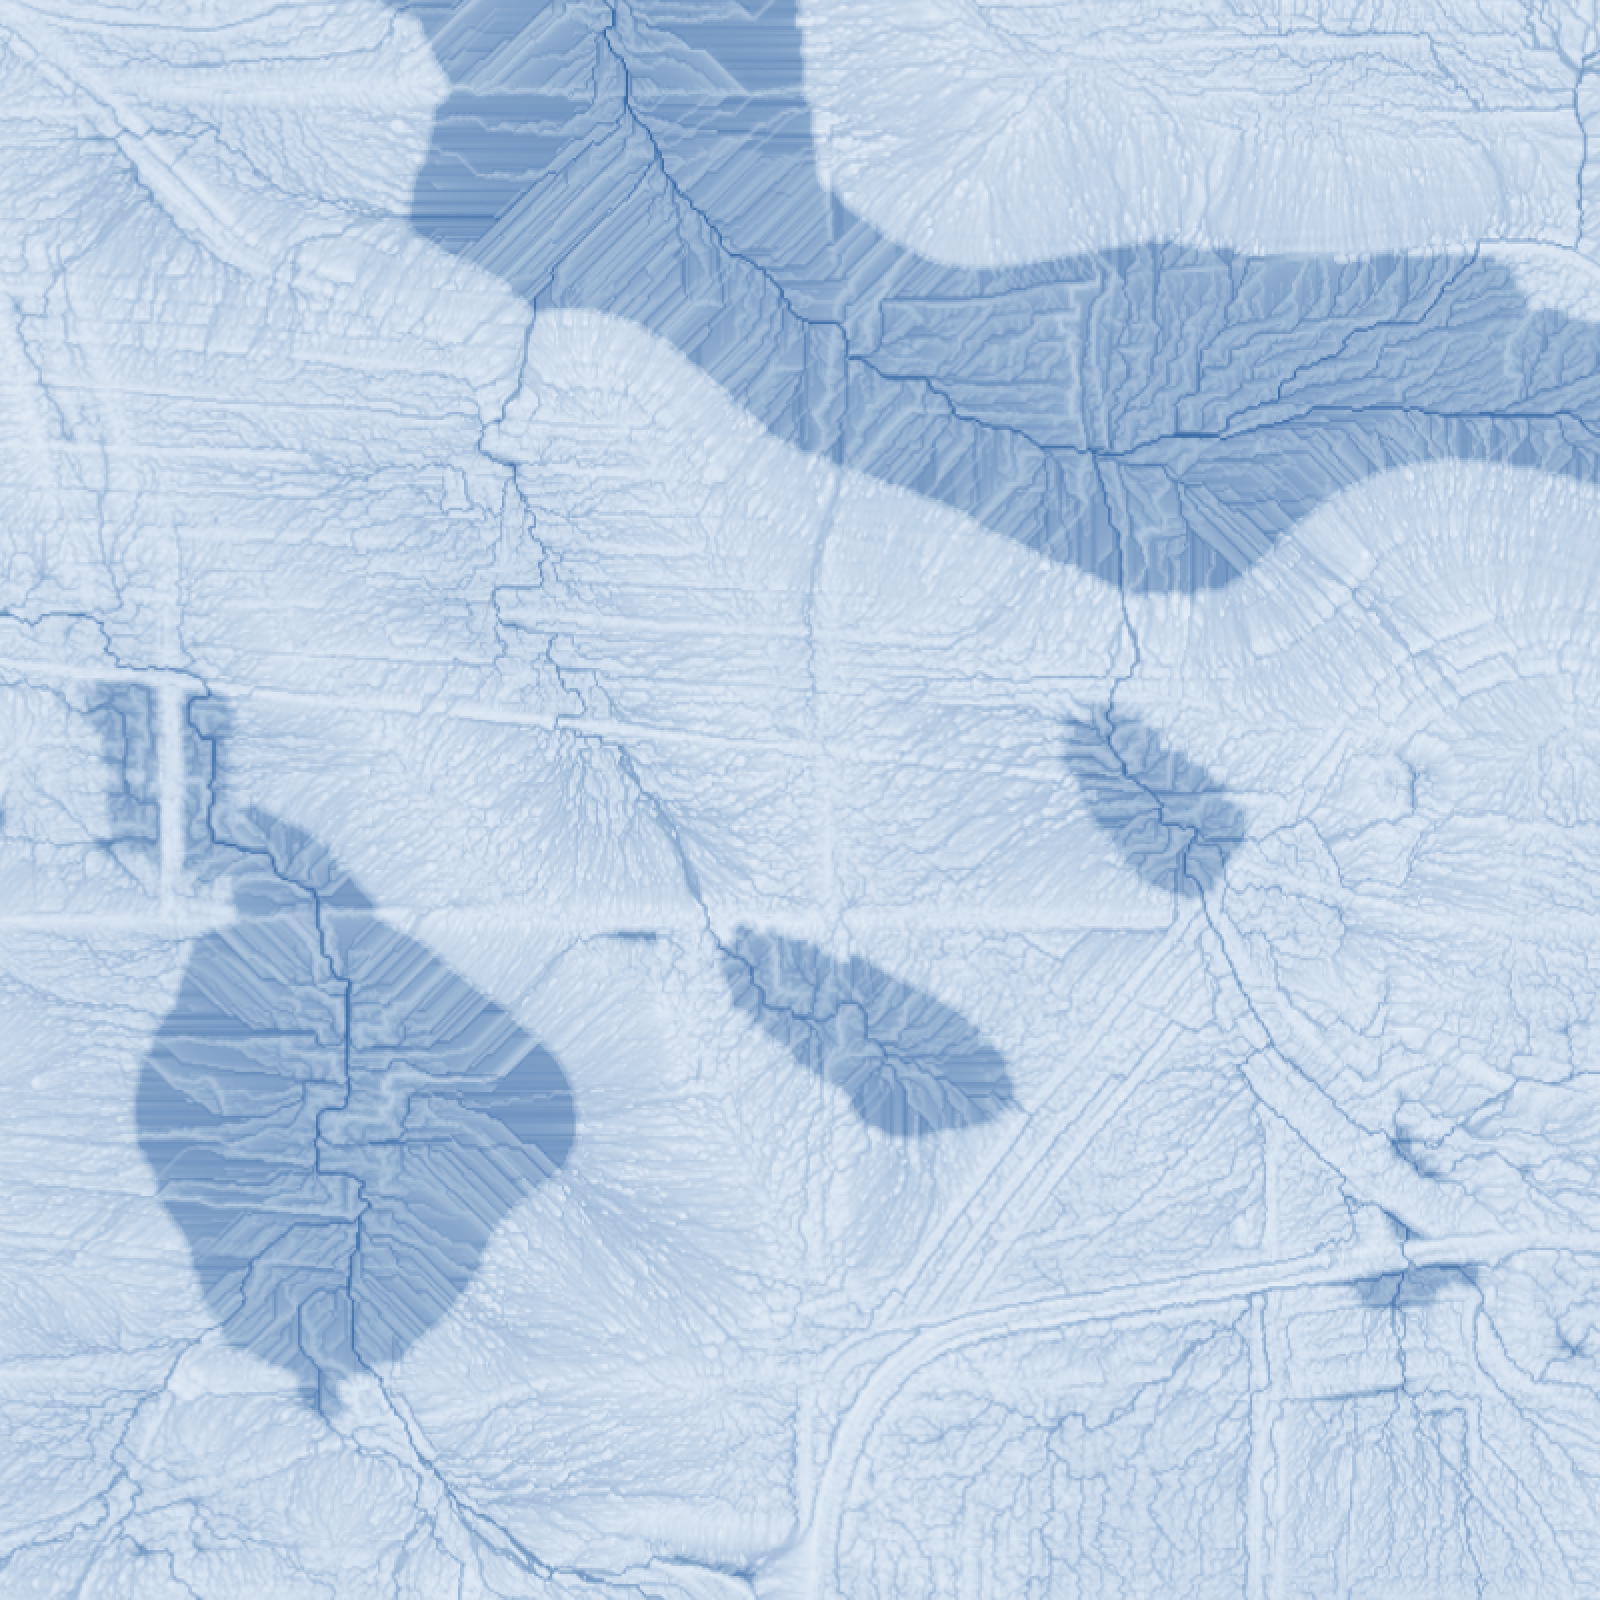
The Topographic Wetness Index represents a sophisticated analysis to identify where water naturally accumulates on the landscape. Unlike simple observation that only shows current conditions, TWI uses the physics of water movement to identify moisture patterns under various scenarios. This index calculates the tendency for any point on your landscape to accumulate water based on how much area drains to that point and how readily water can flow away. Areas with large upslope contributing areas and gentle slopes score high on the index, while steep slopes with minimal upslope area score low. We provide multiple threshold levels to show increasing probability of wetness, from areas that might be moist during spring to locations likely to have year-round saturation.
TWI Classifications
- TWI 90th Percentile: Baseline wet areas representing the wettest 10% of your landscape—typically moist during normal rainfall
- TWI 92.5th Percentile: Wetter areas comprising 7.5% of your property—consistently damp through most growing seasons
- TWI 95th Percentile: Very wet areas making up 5% of your land—nearly permanent moisture, possible spring locations
Understanding your land's TWI patterns transforms water from an unpredictable resource into a mappable, manageable asset. Those 95th percentile areas that stay moist through summer droughts become your insurance policy against climate variability—natural locations for ponds that fill reliably, constructed wetlands that filter greywater year-round, or bog gardens producing specialized crops. The gradient from dry to wet areas revealed by TWI guides species selection with precision, eliminating costly trial and error. You'll know exactly where drought-tolerant crops can thrive without irrigation, where water-loving species will take off, and where standard fruit trees would suffer from wet feet. For infrastructure planning, TWI is invaluable—building in high TWI areas means perpetual moisture problems, failed septic systems, and cracked foundations, while using these areas for their natural water-handling capacity saves thousands in drainage infrastructure. This predictive power extends to seasonal planning as well; TWI shows which areas will remain productive during droughts and which will become accessible only in dry seasons, essential knowledge for scheduling grazing, harvesting, or maintenance activities.
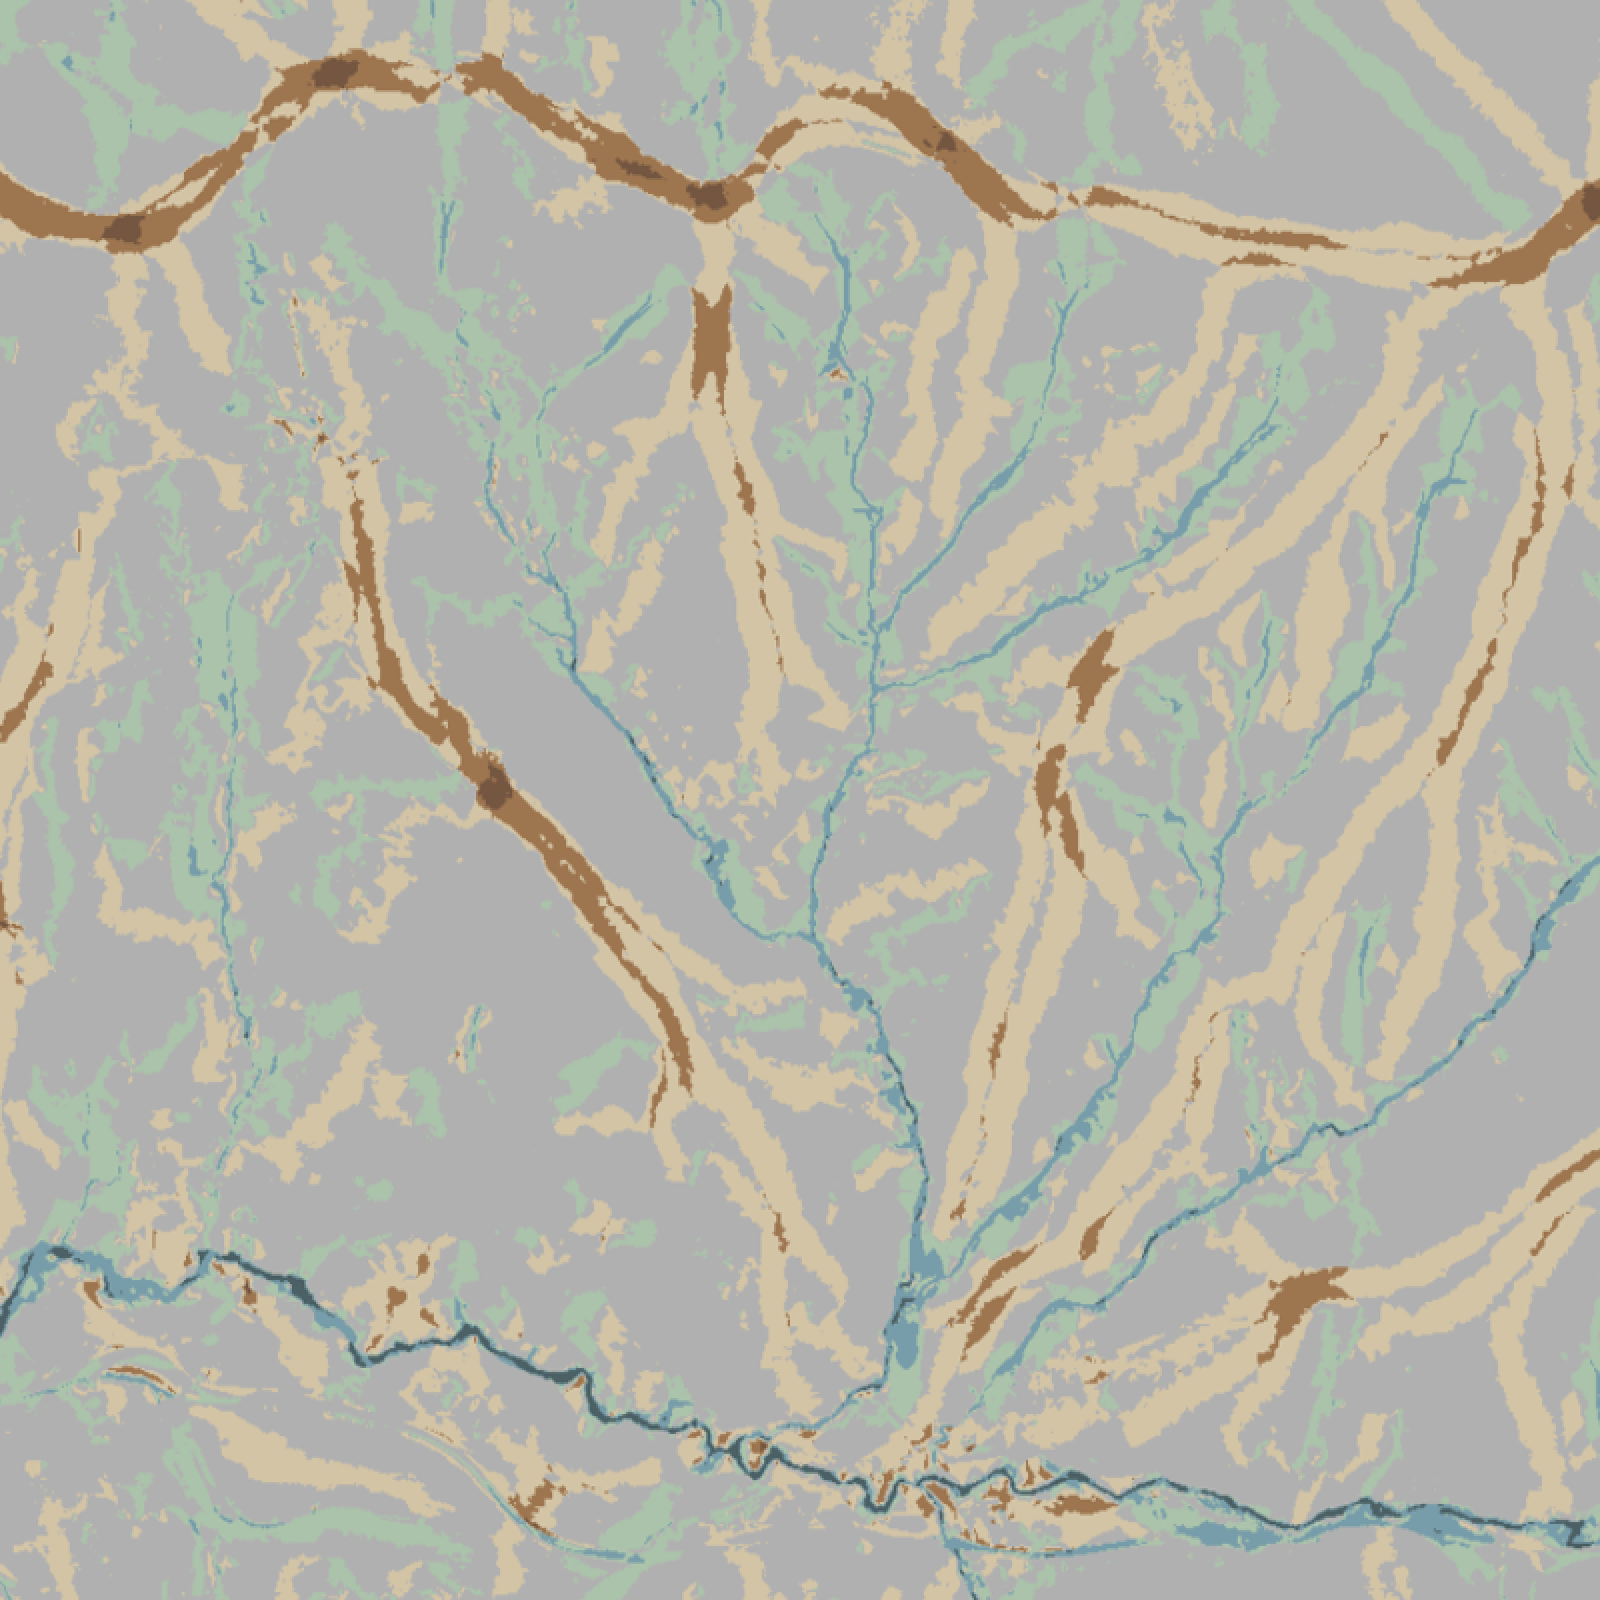
Flow Accumulation
Flow accumulation analysis calculates the upstream contributing area for every point on your landscape, essentially counting how many uphill cells drain through each location. Starting from the highest points on your property, the analysis tracks how water would flow downhill, accumulating in flow paths to show where runoff concentrates. Each cell in the resulting map contains a number representing its upstream drainage area—a cell with a value of 100 has 100 upstream cells draining through it, while a value of 1000 indicates a much larger contributing area. These accumulation patterns reveal your property's entire drainage hierarchy, from dispersed sheet flow on hillsides where values are low, to concentrated channels in valleys where hundreds or thousands of cells contribute flow. The analysis assumes water follows the steepest downhill path, creating a mathematically derived map of where water wants to go during runoff events.
The practical applications of flow accumulation data extend far beyond basic drainage planning into the realm of precision water harvesting and infrastructure design. Those high-value accumulation points indicate prime locations for water capture—a pond located where the map shows 500 cells of accumulation can harvest runoff from that entire upstream area without extensive diversion channels. The map reveals erosion points where dispersed flow concentrates into channels, allowing preventive measures like check dams or infiltration basins before gullies form. Road builders can use this data to identify optimal crossing points where drainage areas are smaller, reducing construction costs and maintenance. The economic value is substantial—water harvesting systems positioned at natural accumulation points operate passively without pumps or complex engineering, while understanding flow patterns helps you work with your land's natural drainage rather than fighting against it.
Drainage Network
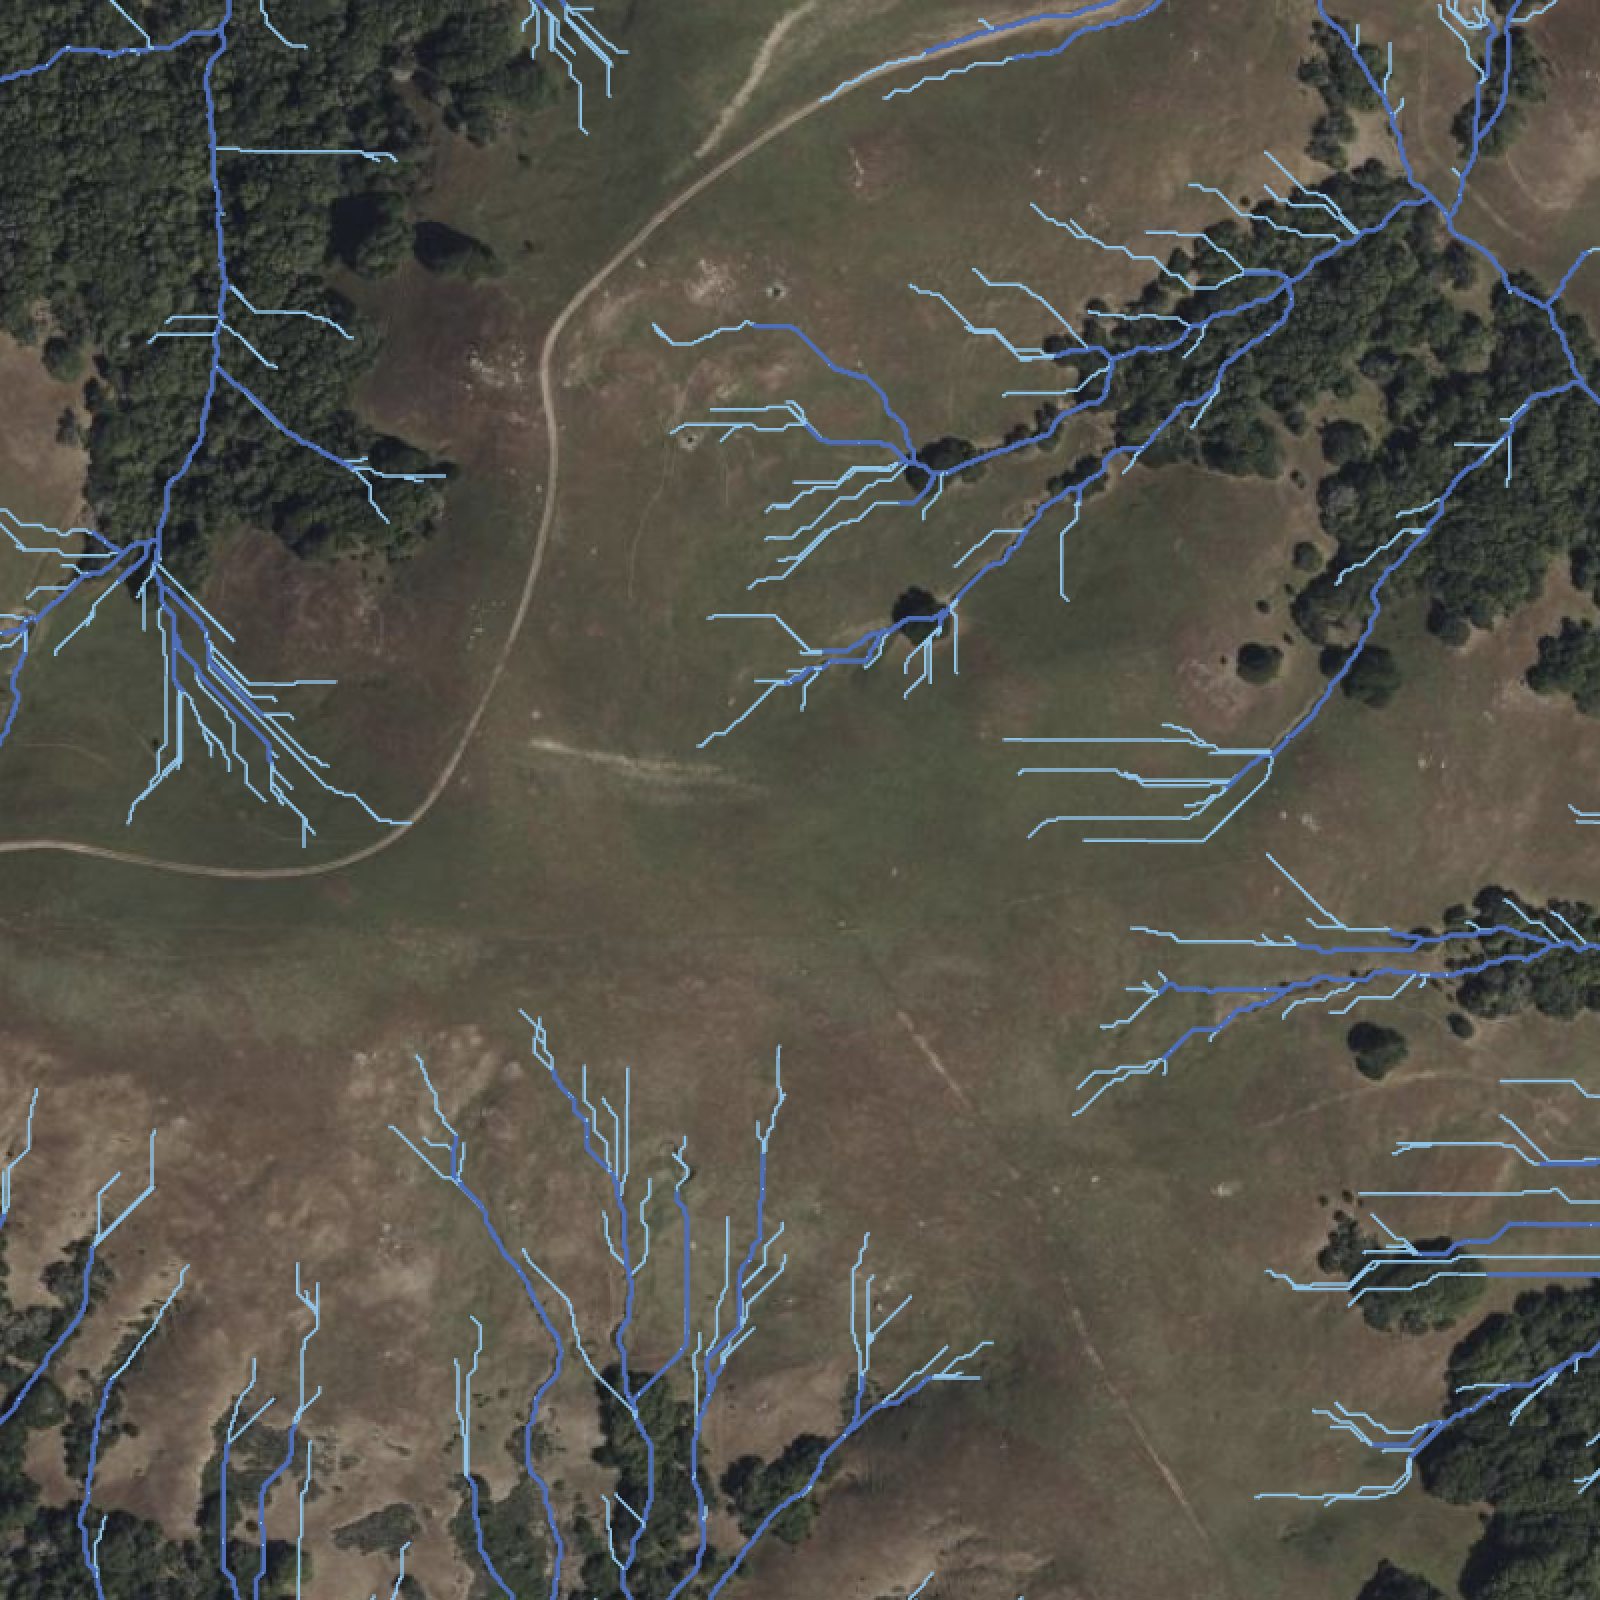
The drainage network classification maps your property's natural plumbing system, categorizing water channels by size and flow characteristics from tiny seasonal rills to major stream channels. This hierarchical mapping goes beyond simply marking stream locations to provide detailed classification of each drainage feature's size, flow duration, and landscape function. By understanding the full spectrum of drainage features, from micro-drainages that only flow during rain events to major channels with perennial flow, you gain insight into how water moves across your land at different scales and seasons. This classification system helps distinguish between drainage features you can modify, those requiring permits, and those best left undisturbed.
Drainage Network Classes
- Micro Drainage Features: Smallest channels flowing only during rain events
- Minor Drainage Channels: Seasonal channels with defined bed and banks, flowing after significant rain
- Intermediate Drainage Channels: Larger seasonal to semi-permanent channels with extended flow periods
- Major Drainage Channels: Primary watercourses where increased flows occur during larger rain events, if not already flowing year-round
Understanding your drainage network hierarchy enables you to be proactive about water management, allowing you to work with each scale of water movement effectively. Those micro drainage features, while insignificant individually, collectively move enormous amounts of water and soil—simple interventions like brush weirs or rock checks in these small channels can infiltrate thousands of gallons that would otherwise leave your property. Minor channels present opportunities for sequential check dam systems that create productive terraces while preventing erosion, turning problems into production areas. Intermediate channels often represent the sweet spot for farm-scale water development—large enough to provide significant water for pond construction but small enough to work with using local equipment and materials. Major channels, while typically protected by regulations, offer opportunities for irrigation rights, micro-hydro development, or simply beautiful landscape features that add value to your property. This classification system also guides regulatory compliance, helping you understand which features require permits to modify and which can be enhanced without bureaucratic oversight, saving time and avoiding costly violations.
Geomorphons (Landform Classification)
Geomorphon analysis uses advanced pattern recognition to classify every point on your property into one of ten fundamental landform types, revealing the skeleton of your landscape. This classification system identifies the basic building blocks of terrain—peaks, ridges, shoulders, spurs, slopes, hollows, footslopes, valleys, pits, and flats. Each landform type has characteristic patterns of water movement, soil development, microclimate, and ecological function that have big implications for your property planning.
Geomorphon Classes
- Peak: Summit areas, local high points with maximum exposure
- Ridge: Linear high features forming watershed divides
- Shoulder: Convex slopes transitioning from ridges to hillsides
- Spur: Secondary ridges extending from main ridge lines
- Slope: Planar areas neither distinctly convex nor concave
- Hollow: Concave areas where slopes converge, collecting water and cold air
- Footslope: Transition zones where slopes meet valley floors
- Valley: Low areas between hills where water naturally collects
- Pit: Closed depressions with no surface outlet
- Flat: Level areas with minimal slope in any direction
This landform classification provides a natural template for land use planning that has been tested by nature over geological time. Each landform type comes with its own opportunities and constraints that guide appropriate use. Shoulders and spurs, with their convex shapes and good drainage, naturally suit orchards and nut trees whose deep roots can access moisture while crowns stay above frost layers. Hollows, despite their challenging cold air accumulation, often harbor springs and diverse plant communities, making them ideal for pond sites or specialty crops that benefit from consistent moisture and cooler temperatures. Footslopes represent premium agricultural land where centuries of erosion have deposited deep, fertile soils while maintaining enough slope for drainage. This classification system also reveals subtle development opportunities—those rare flat areas within rolling terrain command premium values for building sites, while natural benches on spurs provide stable construction sites with views. Understanding geomorphology helps explain why certain areas of your property behave as they do—why that ridge stays dry even in wet years, why the hollow floods every spring, or why the footslope grows the best pasture. This deep understanding transforms land management from fighting patterns to working with them.